Journeys
The Evolution of Funnels
Traditional funnels are outlined as paths that begin with a starting action or goal, followed by subsequent actions that users have to perform to be in the funnel. To reach the end, users had to complete each goal as defined in the funnel.
We recognized that a common pain point for Woopra users was that if their users took alternative paths to reach the same goal, they needed to build multiple funnel reports in order to perform that analysis. This approach seemed a bit rigid given that customer journeys can be much more fluid and complex today.
Introducing Journeys in Woopra
While you can still build a funnel with Journeys, Journeys allow you to map the end-to-end customer experience to reflect a non-linear journey across multiple customer touchpoints so that you can identify each customer’s unique journey on the path to conversion.
Now, we have introduced the ability to build a non-linear journey using ‘steps’. Any step in a journey report can be enabled/disabled in order to view its effect on the analysis right away. You can keep adding several steps to your journey and enable/disable any step until you have reached the result you are looking for. This way, it eliminates the need to build multiple reports to compare results that give you the analysis that makes the most sense to your business.
Apart from the enable/disable feature, we have also brought the optional steps feature to the front, right next to the enable/disable feature. With optional steps, users do not have to perform that particular action before moving on to the next step.
Using Journeys, you will be able to combine unique event and visitor properties to map customer journeys that adapt to the real-time behaviors of their customers. Journeys will make it extremely easy to build a multi-dimensional chart that covers all possible scenarios for a given segment of users. This opens up a world of possibilities in terms of measuring where and how your users convert.
Benefits of Journeys
Explore all possible paths to conversion
Journey reports let you instantly explore all the possible conversion paths that your users take in order to reach the final conversion step in their engagement journey. You can capture customer reactions and expectations with your product so you can determine how to deliver more positive experiences.
Perform multi-channel attribution in a single chart
Compare how engaged your users are in each step of your attribution funnel. Optional steps let you expand your customer journey so you can perform an unbiased analysis
Find exactly where your users churn or disengage with your product
Identify each feature or event that leads to a drop in conversion so you can determine where your users churn or disengage with your product and prevent it from happening in the future.
Types of User Journeys
At Woopra, we think of Journeys as a combination of any of the following use cases:
1. End-to-End Customer Journey
End-user Personas: CEO, CRO, VP Growth, Analyst
Oftentimes, you want to view an entire customer journey from a first time visit to signup all the way to churn. End-to-end journeys help you put the people behind the overall company numbers and enable you to make critical business decisions. For instance, an end-to-end customer journey may look like:

With Woopra Journeys, you can identify how many people drop off at the pricing page versus those that make it to signup, create their first project but fail to engage with the product and churn. Such journeys help you identify critical steps in your customer journey and ensure that you define all the right metrics to avoid churns.
2. New User Conversions
End-user Personas: Sales, Marketing, VP Growth, CRO
New user conversion journeys allow you to track the steps taken by new visitors on their path to conversion. For example, let’s say you want to identify the number of first time visitors on your website via a paid ad campaign and analyze the steps they take before they sign up for your product.

Here, we know that our main steps such as clicking on an ad, downloading the app and signing up for the product indicate conversion. The rest of the steps are optional and users may or may not go through them to reach the final step. You can create as many optional steps as you like in order to analyze your multi-dimensional journey.
3. Product Usage
End-user Personas: Product Manager, Customer Success, VP Growth, CEO, Developer
Product Usage journey let you analyze what features are being used most frequently, what features confuse your users, what they like and dislike in your web or mobile app. For instance, a Journey report gives you the ability to view how many users engaged with the core features of your app, how many went through each step of the on-boarding process or how many dropped off before completing the on-boarding process altogether.

In this user journey, you can tell how many users created a project, how engaging are your learning tutorials and online support and how many end up using the main features of your app.
4. User Engagement or Churn
End-user Personas: Product Manager, VP Growth, CRO, CEO
Once the users have gone through the on-boarding process and started using the core features of your product, it is critical to retain them in your app. Journeys give you the ability to assess the stickiness of your product by identifying the paths users take to engage with your app, what actions do they take to generate value for their business and how your app is delivering on that value. You can feed this analysis into your future product roadmap.
If your product fails to engage new and existing users constantly, it is likely that they will churn over time. Journeys are a great way to keep track of whether you are successfully engaging your users and delivering a consistent experience. Let’s say you want to assess how your new feature is performing. Consider the following Journey:

In this example, if many people end up reaching the last step, it may indicate that they either do not like the new feature or did not understand how to use it. Journeys are a great way to keep track of whether you are successfully engaging your users and delivering a consistent experience.
How to create a Journey Report
Let’s say you are a B2B SaaS company and you want to analyze the journey of freemium users that upgraded to a paid plan in the last quarter. You create a new user conversion journey in Woopra. In this journey report, you want to analyze the steps that your users went through before they upgraded to a paid user.
Step 1: Identify the steps in your journey.
Freemium User Conversion Journey
- Click on activation email
- Watch intro tutorial (optional)
- Complete set up
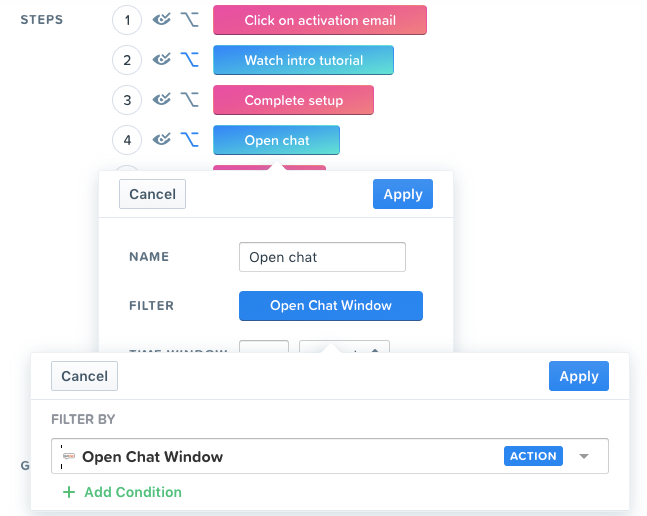
- Open chat window (optional)
- Activation – Create a project
- View blog (optional)
- Visit pricing page (optional)
- Select a subscription plan
- Add credit card
- Upgrade to paid user
Step 2: Configure the Journey report
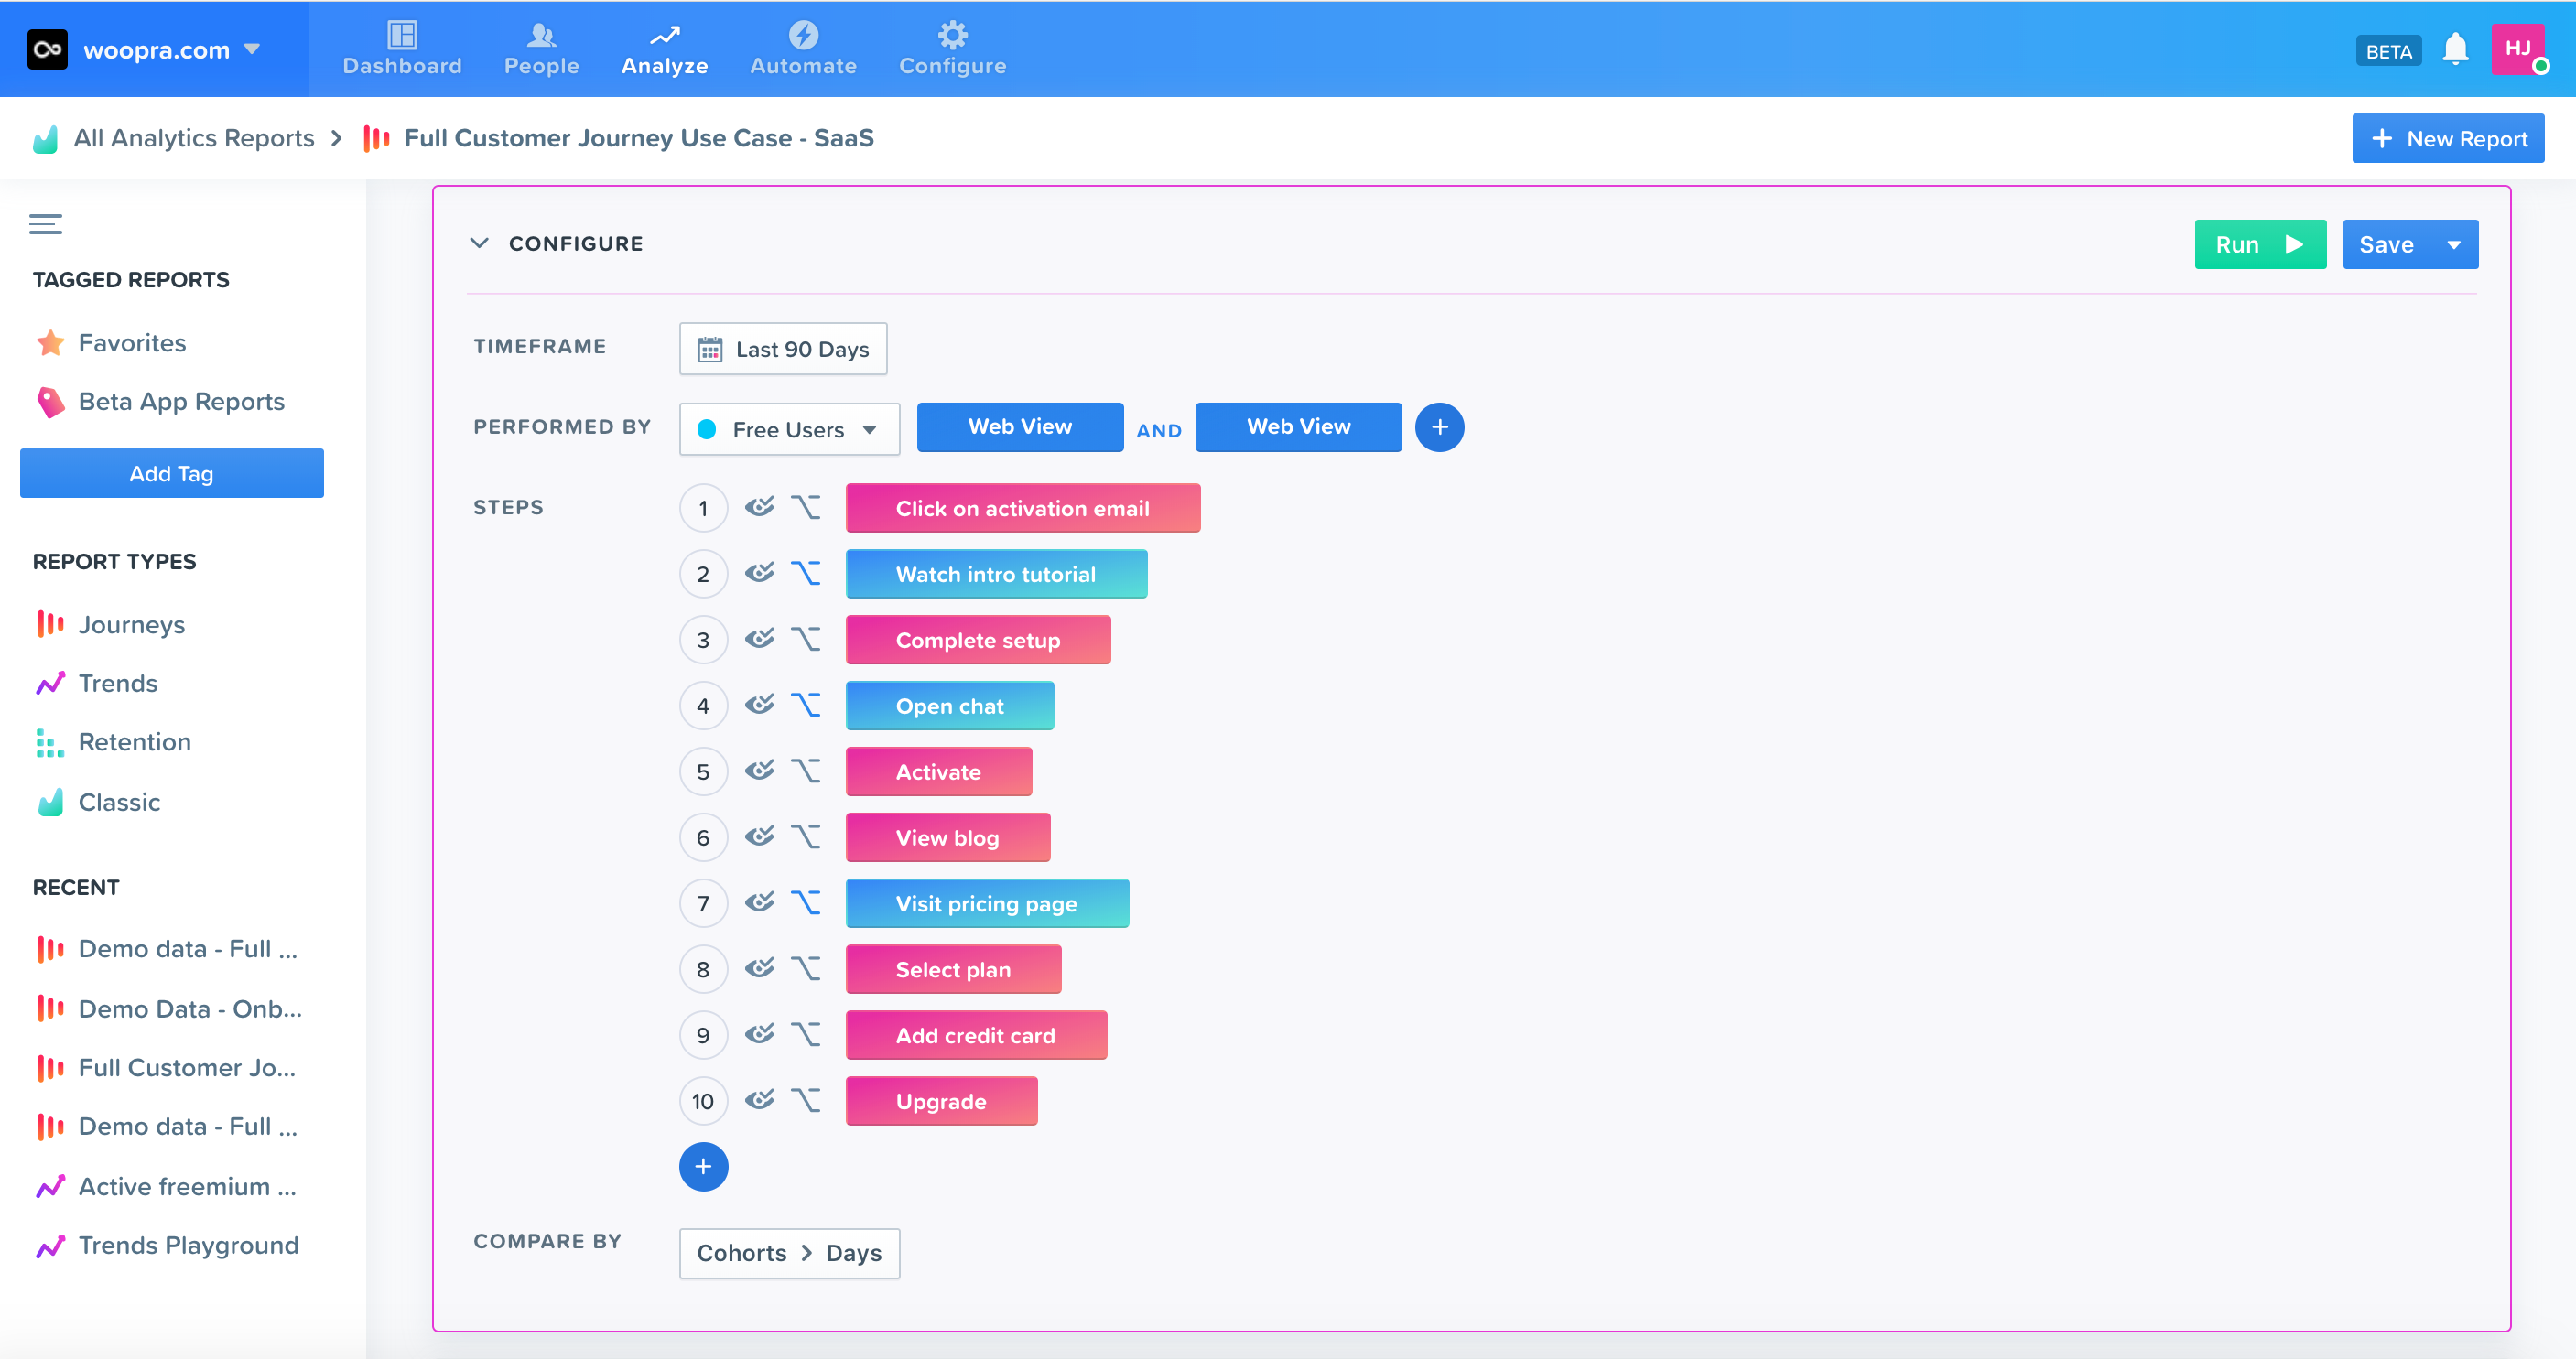
Click on the new report button on the top right. Once you click on Journeys, you will reach the configure section.
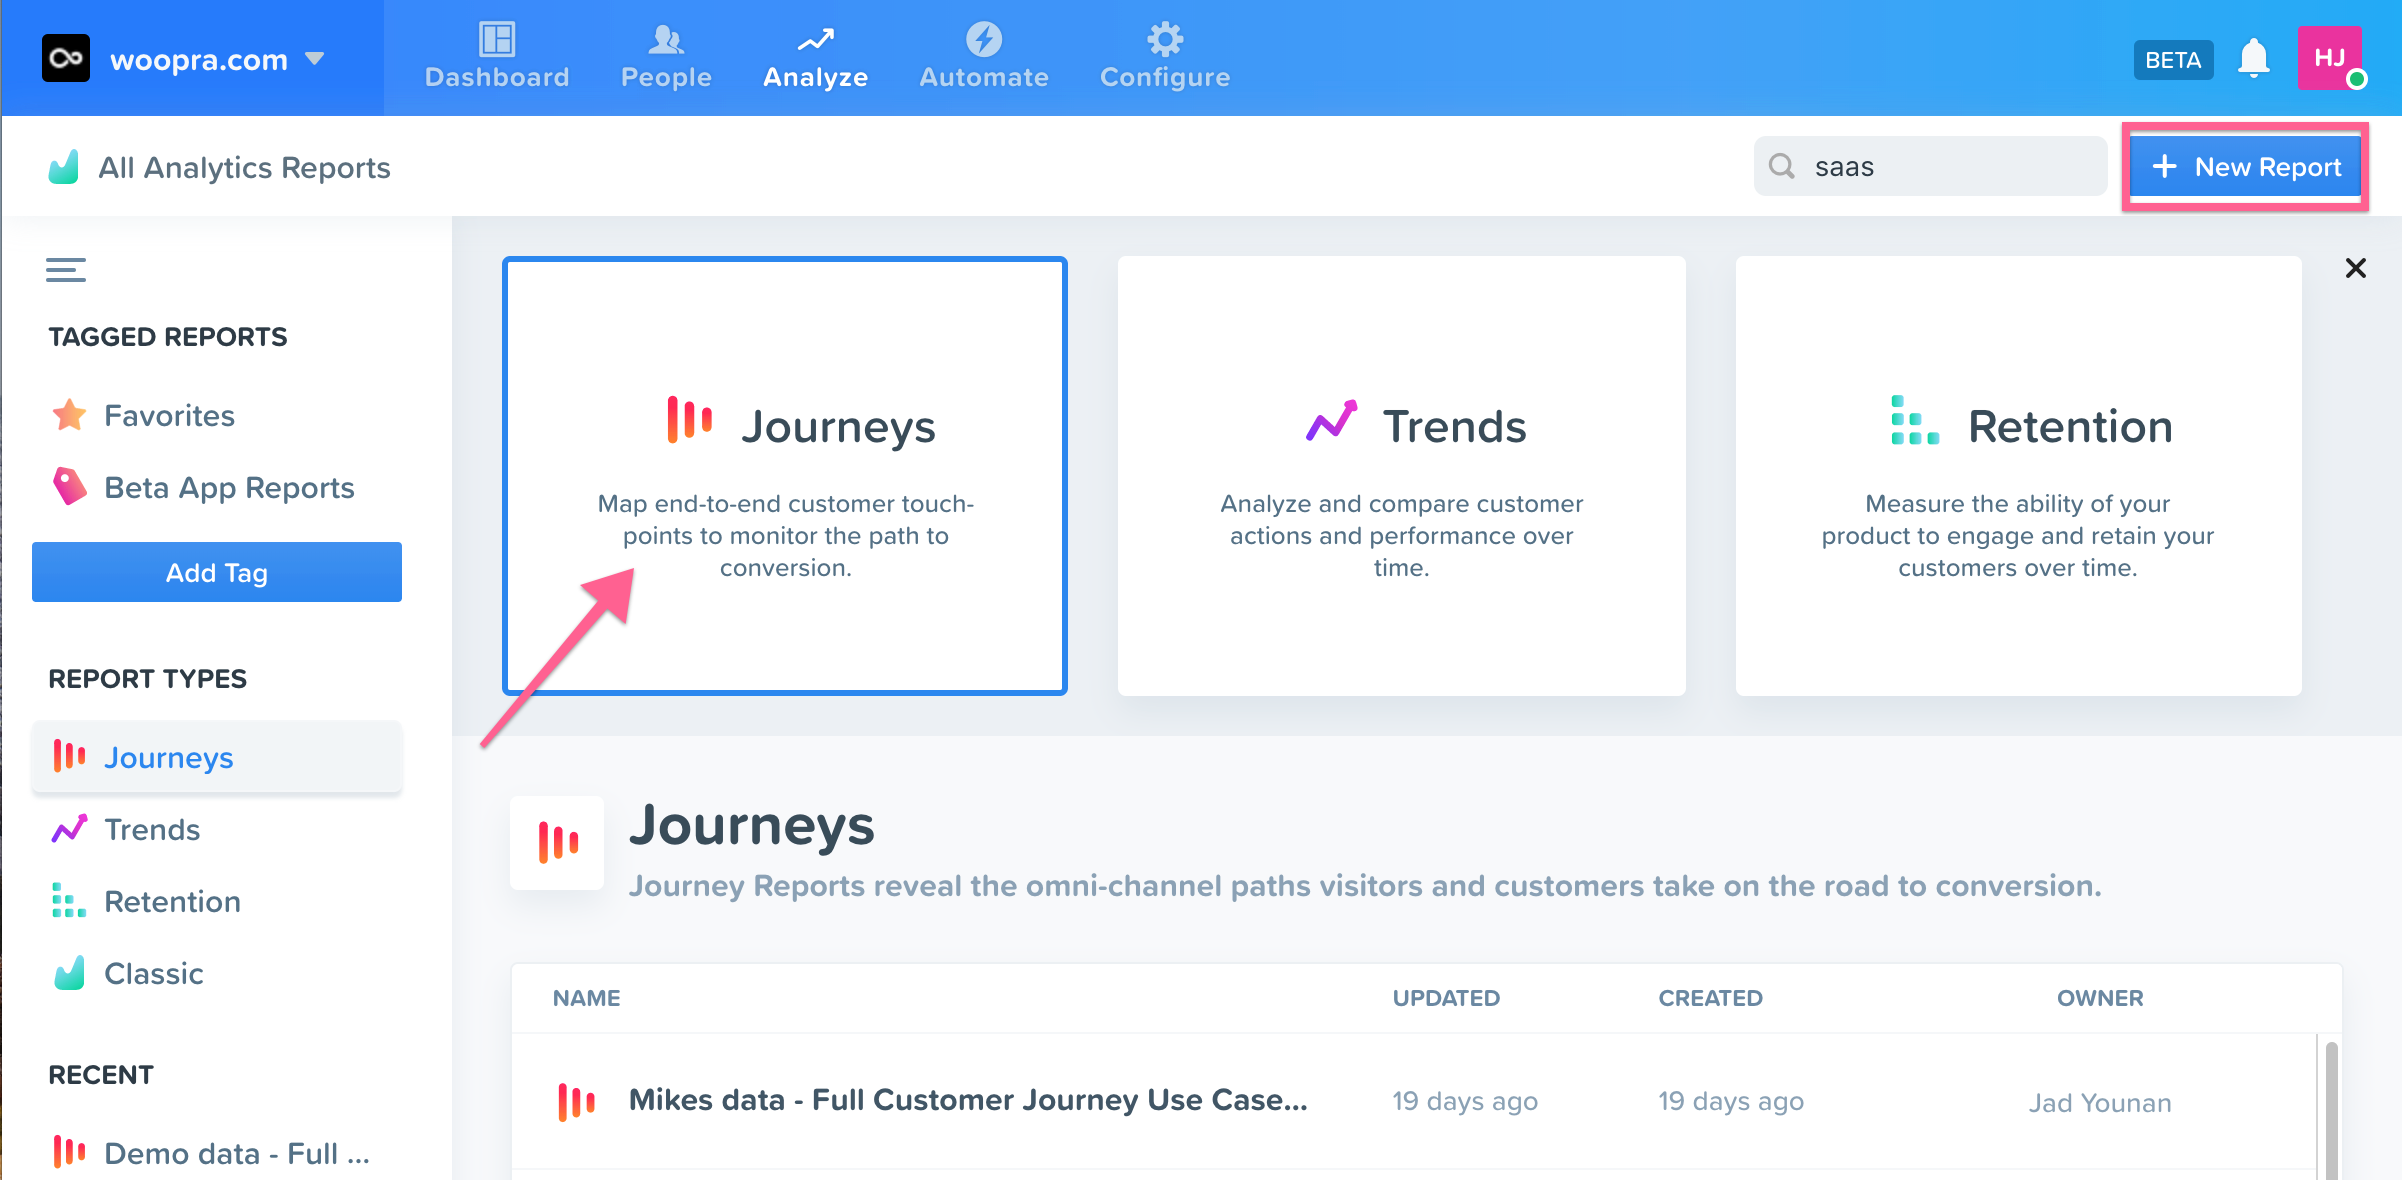
Here are the steps we follow in order to configure a new user conversion report:
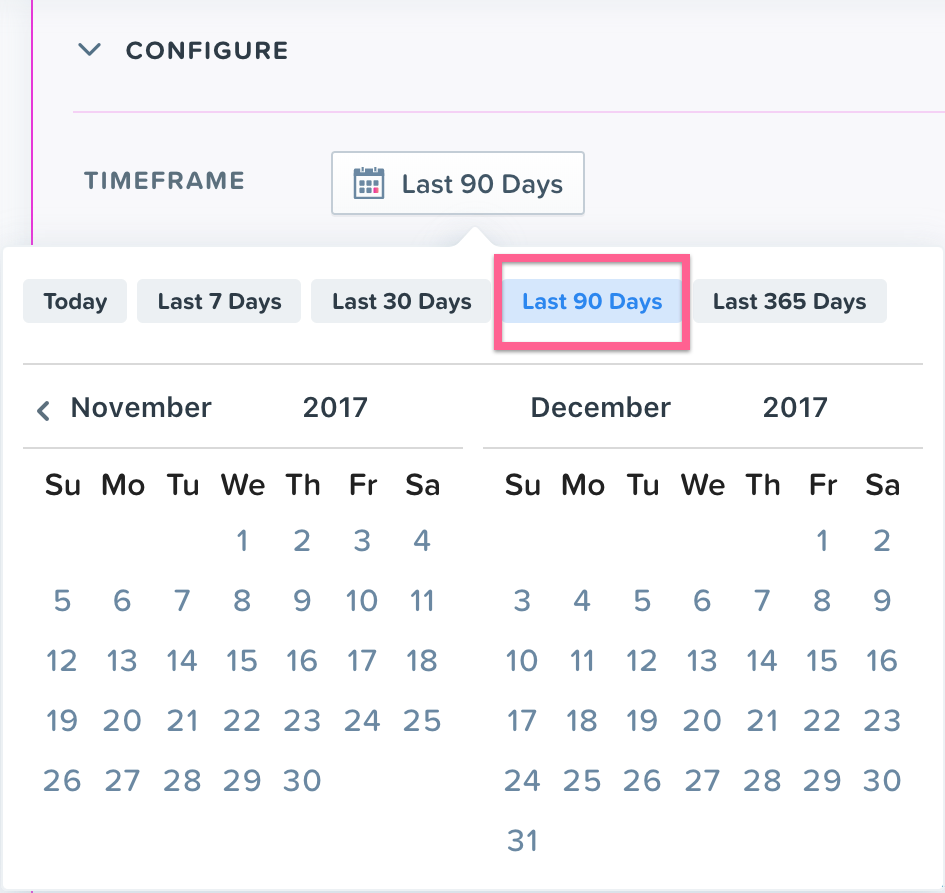
Timeframe: Here the timeframe is the period in which Woopra will examine all your data. You can choose today, last 7 days, last 30 days, last 90 days, last 365 days or any custom date range of your choice. The default date range is the last 30 days. We choose the last 90 days for this example.
Performed By: ‘Performed By’ is a group of people defined by who they are and what actions they take. You can segment by any combination of user actions, visit properties and visitor properties. In this case, we choose all those customers that became freemium users of our app in the last 90 days.

Steps: Once you have defined the timeframe of your analysis and chosen the combination of user behaviors or user segment you want to analyze, you select the steps that your journey should include. Each step is a user action or event that the user may have done to reach the final step in the journey.
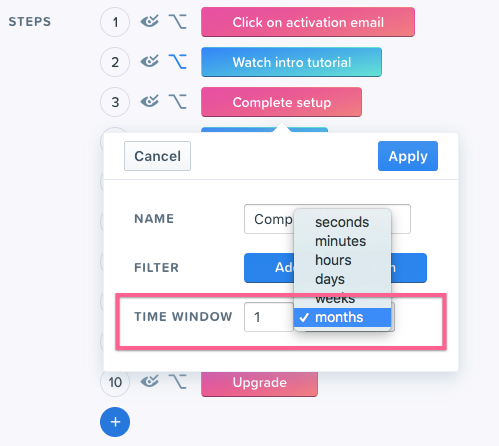
a. Time Window: Once you identify an action for a step, you also get to choose the time window. Time window is essentially the amount of time a user can take to complete a given step from the first step. For instance, we want users to complete setup within 1 month of clicking on their activation email (step 1).
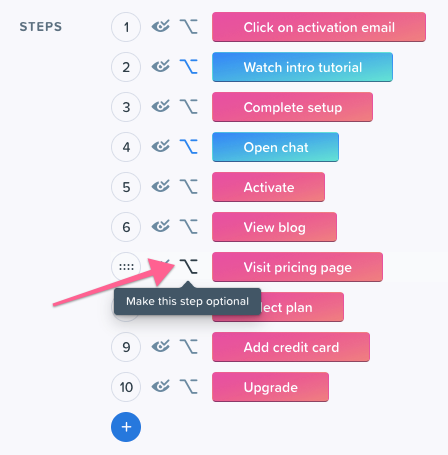
b. Enable/disable: This appears to the left of your step name. You can manually disable a step to remove an action from your analysis temporarily so you can see its effect on your journey.
c. Optional Step: When you make a step optional, it indicates that the users do not have to complete it in order to qualify for the next step. An optional step appears in blue.
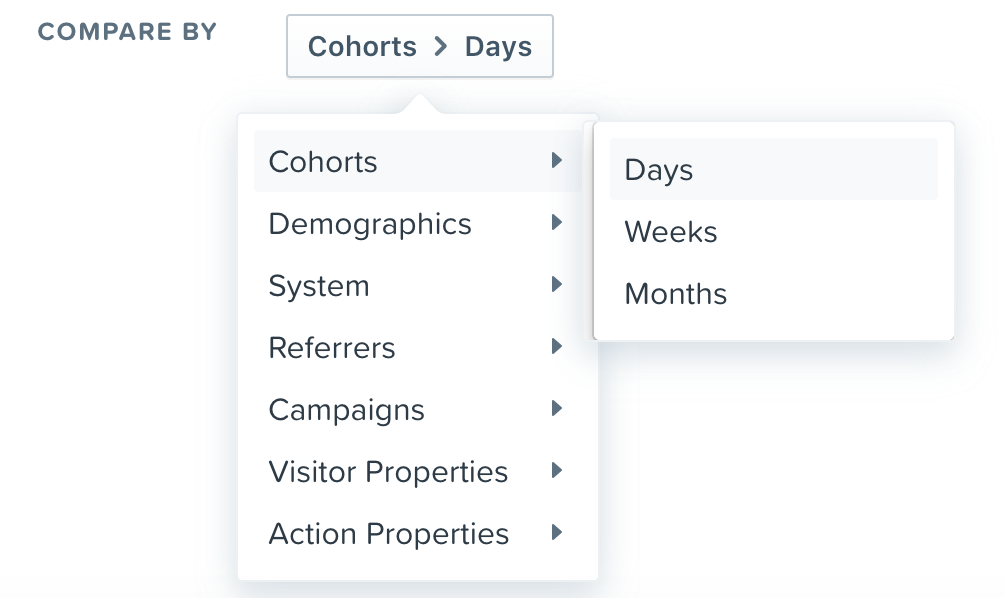
Compare By: Finally, with ‘Compare By’, you can identify the dimension that you want to use to analyze your Journey. These dimensions help you compare the performance of your segments to see how they convert through the journey. Woopra offers a number of built-in dimensions out of the box.
You may choose from time, demographics, system properties, referrers, campaigns or visitor properties to compare the different dimensions that impact your journey. You can also choose from properties of the first step in the journey. By default, Woopra uses date (Cohort > Days) as the dimension to analyze.
Voila! You have now created your first user conversion journey in Woopra.
Analyzing a Journey Report
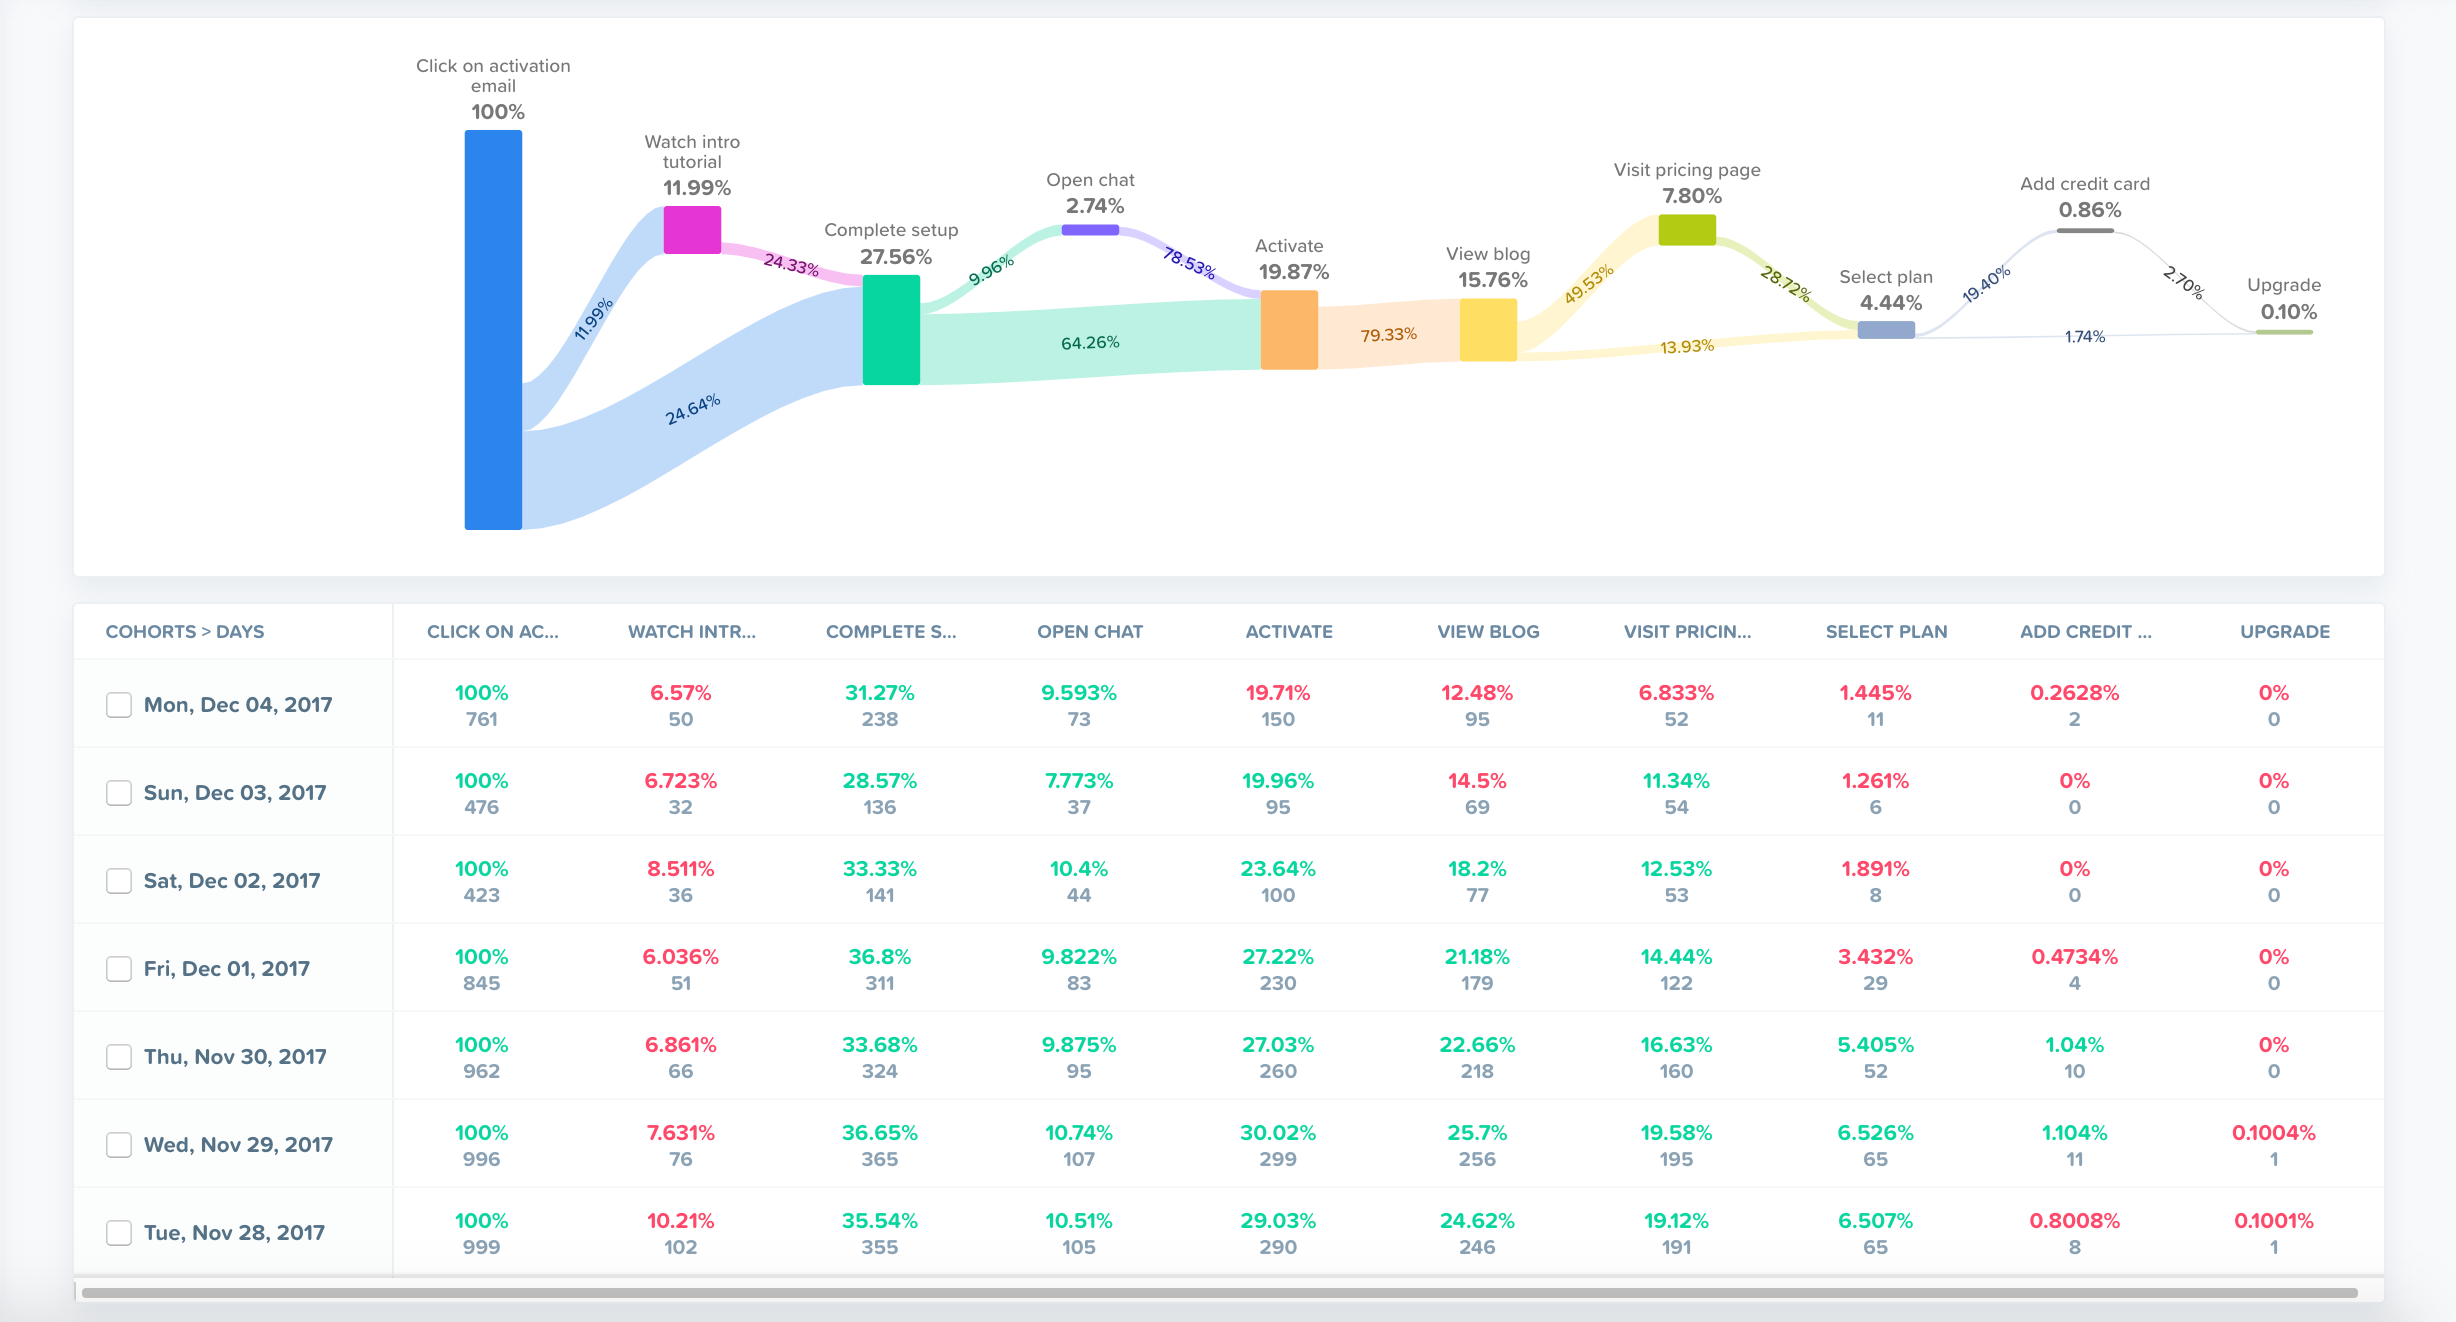
In your graph view, you can see each step in the freemium user journey and the number of users that converted at each step. The percentage of users that converted is indicated on each step of the journey. The bottom of the chart shows the total number of unique users that arrived at each step in the journey and their respective conversion ratios in percentages. The percentages are calculated as the ratio of the total number of unique users at that step to the overall total unique users that qualified in step 1.
For example, in this journey,
12.48% or 4,505 of the total 36,087 users converted at step 2 (watch intro tutorial) which is an optional step and 24.72% or 1,114 of those 4,505 users who converted at step 2 further converted at step 3 (complete setup).
25.55% or 9,222 of the total 36,087 users converted at step 3 (complete setup) directly.
Hence, a total of 10,336 (1,114+ 9,222) or 28.64% of the users completed setup on our app after clicking on an activation email for the first time.
In addition, if you click on individual percentages on the Journey, the graph shows the number of people that convert in that step, the average time it takes for users to convert and the average number of visits it took before they converted. Here, it took our users on an average of 12 hours 22 minutes and 3 visits to go from completing setup to activation.

Updated over 5 years ago
