Activity Reports

Overview
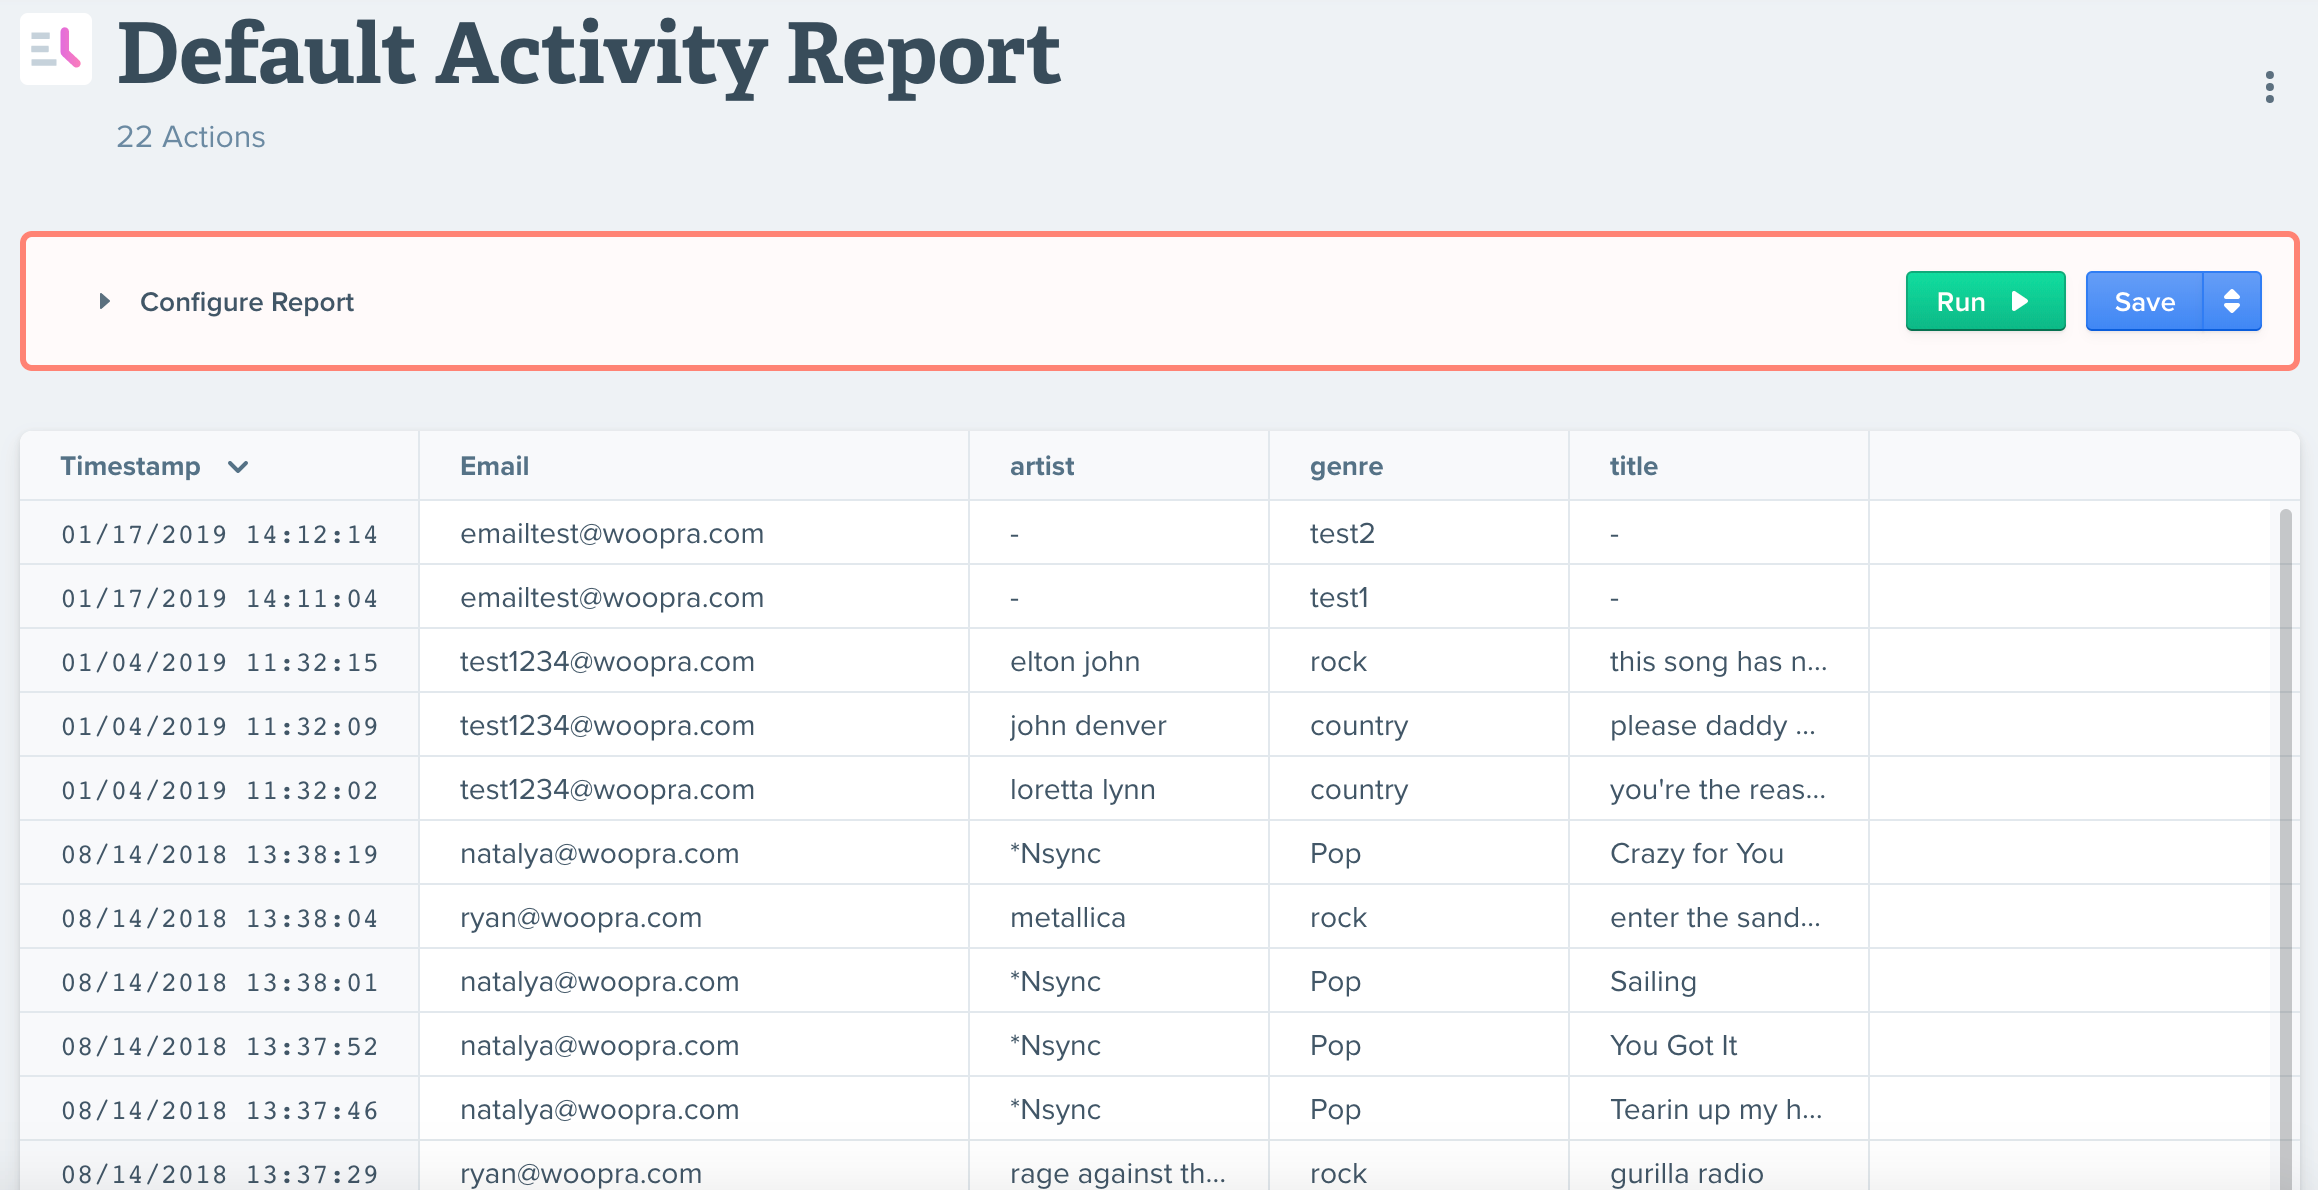
Activity Reports allow you to see a list of user activities. For example, if you wanted to see a list of new sign-ups, orders, for a particular day, you can create this in the Activity Report.
Configurations
Activity Reports are comprised of 4 sections: Timeframe, Performed By, Actions, and Columns.

Timeframe
This is the first metric you should choose. Here, the timeframe is the period in which Woopra will examine all your data of users that did at least 1 action during that time frame. You can choose today, last 7 days, last 30 days, last 90 days, last 365 days or any custom date range of your choice. The default date range is the last 30 days. We choose the last 365 days for this example.
Performed By
Think of this step as the segment or group of people you'll be analyzing. Either select an existing segment or create a new one on the fly, by clicking the “+” button in the “Performed By” section of your configuration. More info on how to create a Segment can be found here: Segments
Timeframe DifferencesIt is important to understand the Performed by timeframe configuration differs from the Timeframe configuration above. The Performed by timeframe will create a subset population of people from the Timeframe configuration section.
For example, let's take the following scenario -- You want to run a marketing campaign to target users that are currently active and also made a purchase on last year's Black Friday. First, you would set the Timeframe to the current month to select an initial group of ALL users that have performed at least one action in the current month. Next, under the Performed by timeframe, you select the action “purchased item” with the date for last year's Black Friday. Now, you will have a list of all active users from the past month that purchased an item last Black Friday. Typically the Performed by timeframe is less than or equal to the Timeframe configuration range.
Also here's a quick video explanation as well: https://share.getcloudapp.com/E0uzzAvP
Actions
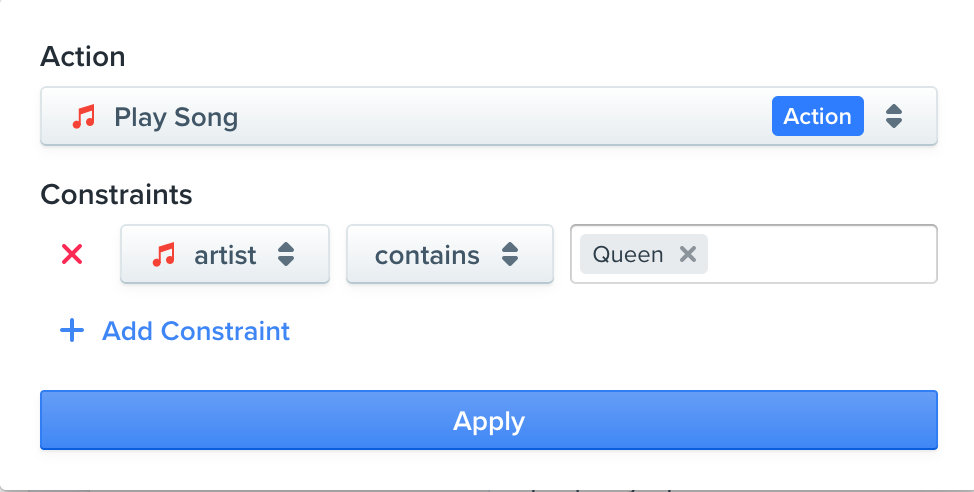
This is the action you want to analyze. You can select any action that you are tracking and add constraints to further filter on the action.

Select your action, then add a constraint. Here we we want to see all the songs that were played by the artist "Queen."
Columns
Here you will select what columns you want to add to the report. Essentially this is what you want to group the results by. For example, you may want certain information displayed such as emails, product names, total amounts, invoice numbers, .etc.
Exporting and Sharing
Now that you've built your report, you'll want to share it with your team. You can do this by clicking on the 3 dots / ellipsis which will open an options menu for exporting, sharing, tagging, pinning, duplicating and reloading your report.
Remember, reports are not shared with your team by default, so you will need to share it for others to access it. Click share from the menu and select what team you want to share your report with.
Downloading
You can download the report in various formats: CSV, CSV (raw), PDF or HTML. Note that CSV (raw) will download some columns, such as average_session_length in total seconds. Exporting the regular CSV for these columns will download timestamps in a string format, e.g. 3 minutes, 21 seconds - 8 minutes, 20 seconds.
Updated 3 months ago
