Profile Reports
Overview
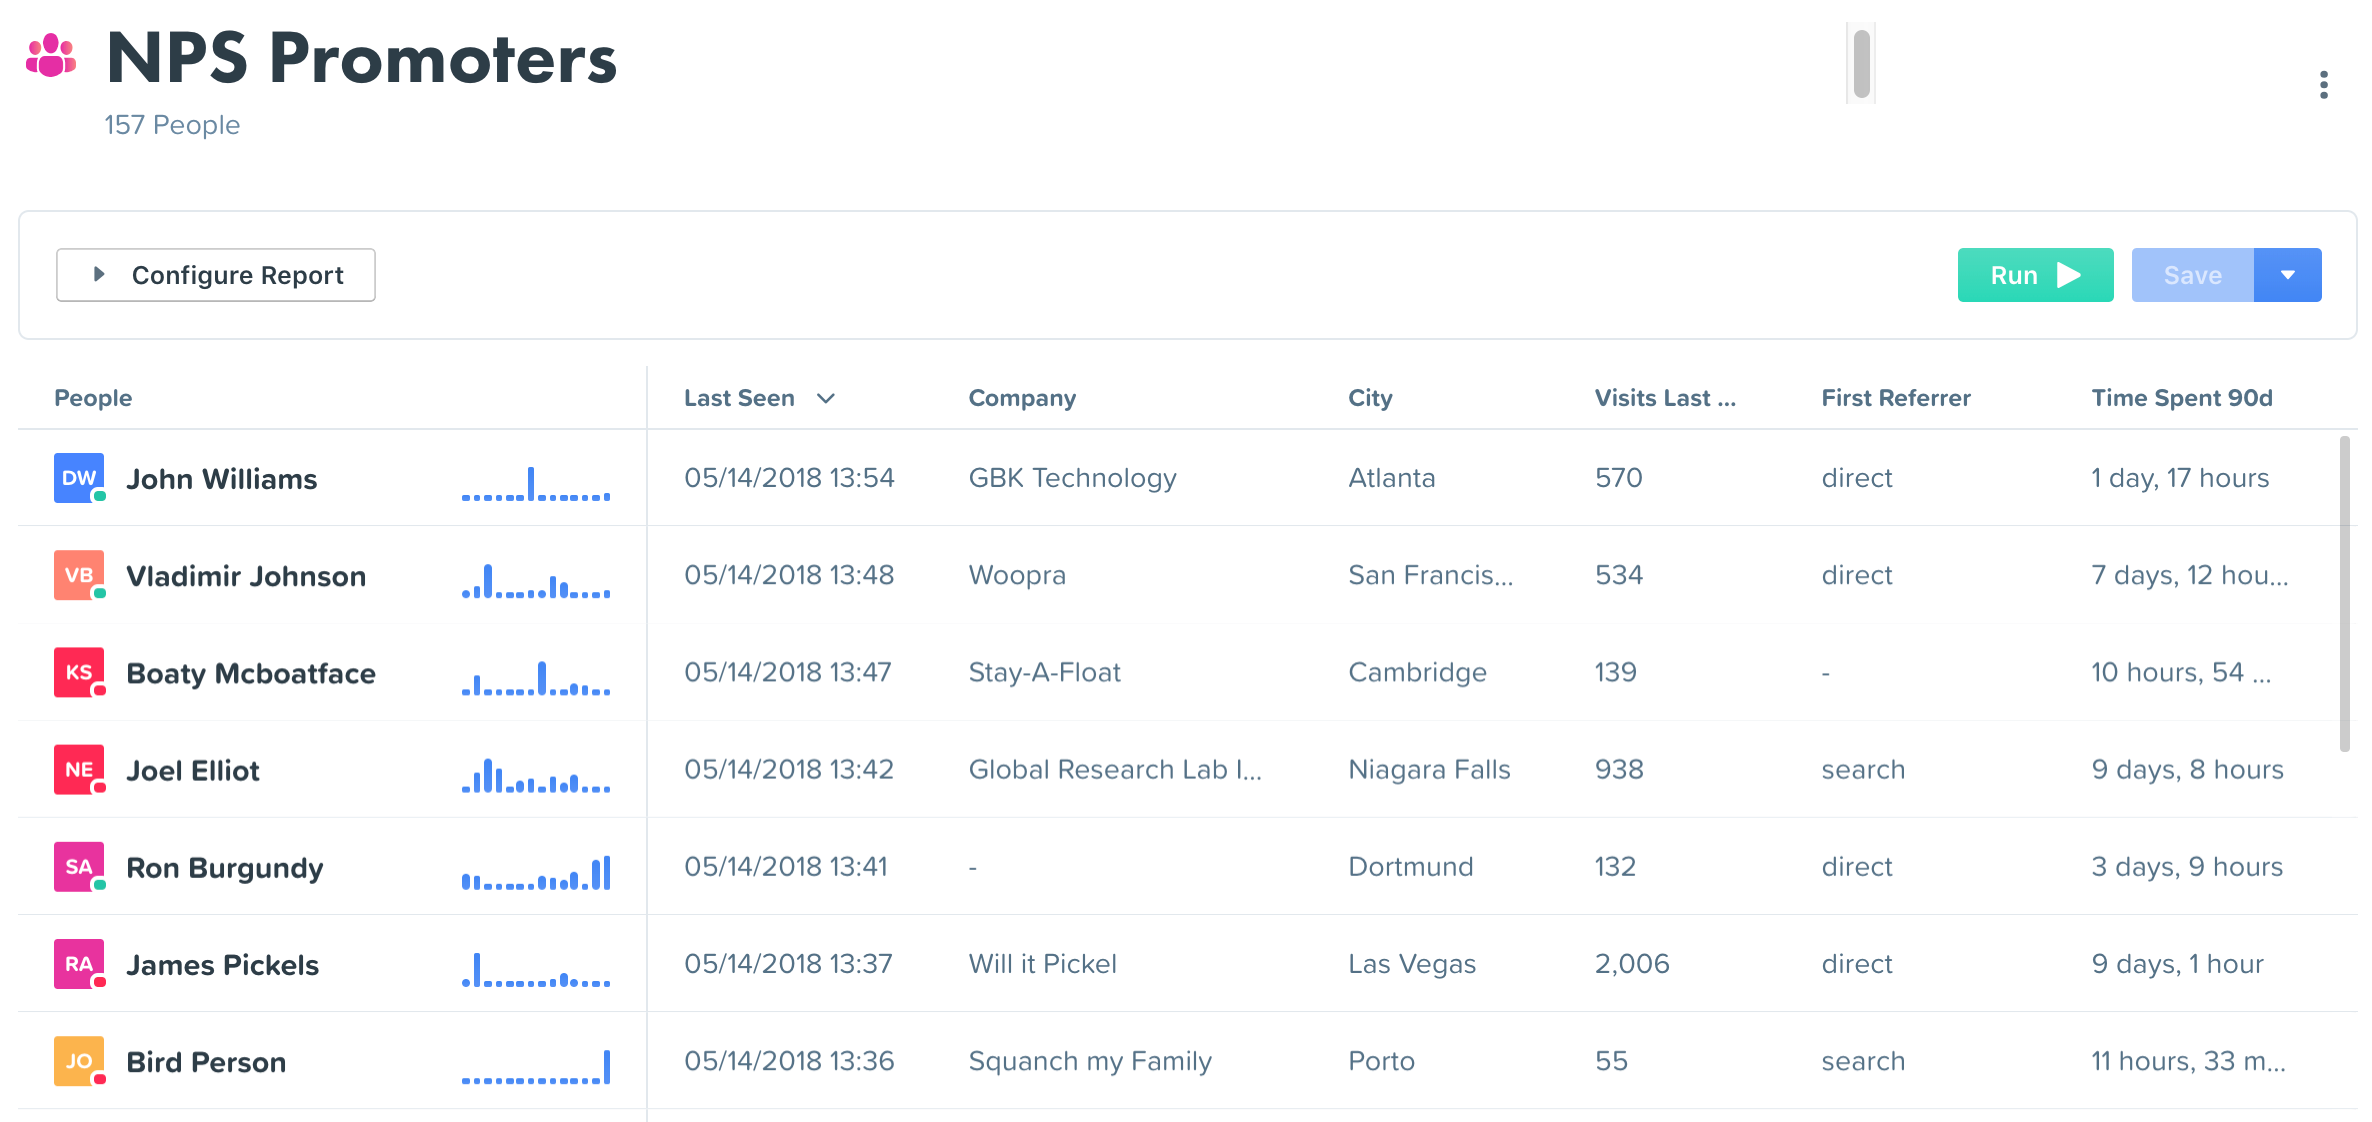
Woopra’s Profile Reports allow you to quickly generate a view of the people engaging with your brand, across the custom metrics that matter most to you. Segment your report based on properties such as transactional history, recency, at-risk-of-churn, engagement and more. Then, add columns to create a personalized view that can be saved for quick reference and future use throughout the platform.
These reports allow you to easily answer questions like:
- Who are the people that are highly engaged in my product?
- Who has recently signed up from a Facebook Marketing campaign and what industry are they in?
- Who is using our latest product feature and where are they from?
How to create a Profile Report
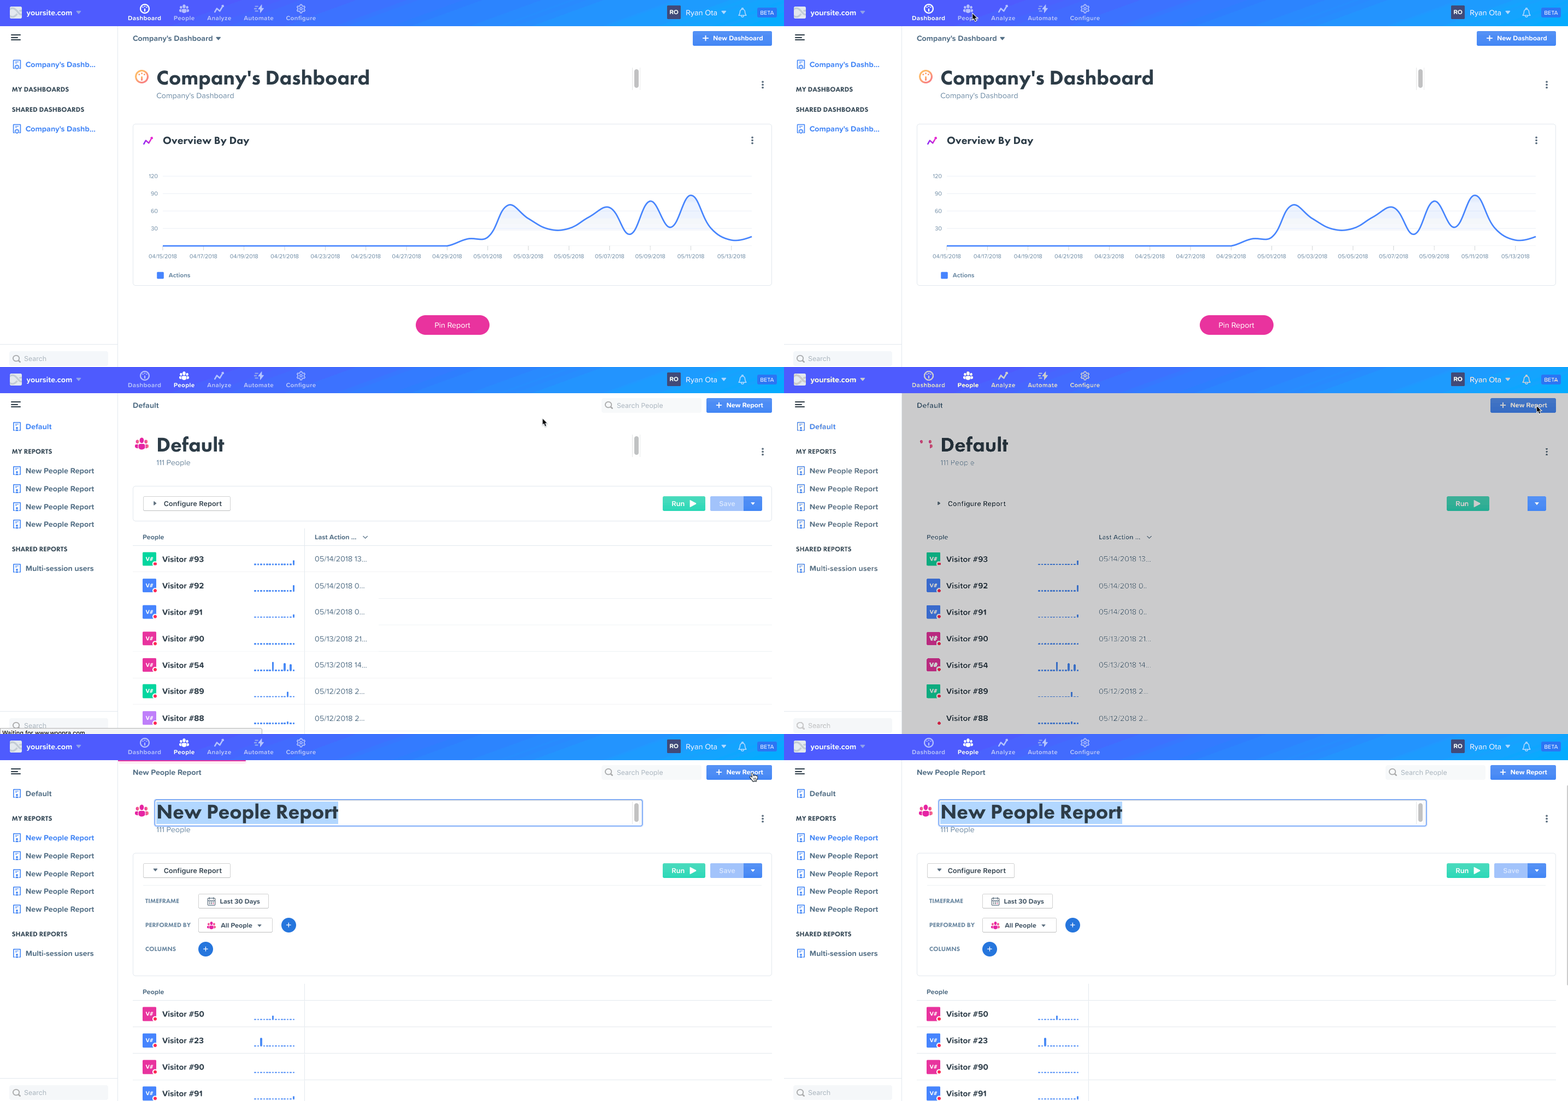
To start a new Profile Report, click on “Profiles” then “New Report.”
Configurations
Profile Reports are comprised of 3 sections: Timeframe, Performed By, and Columns.

Timeframe
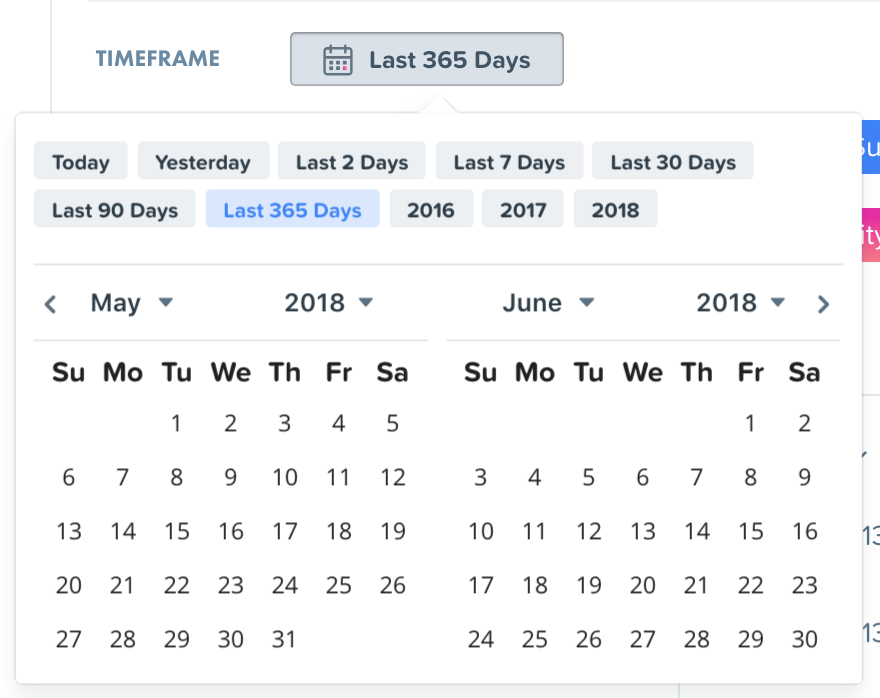
This is the first metric you should choose. Here, the timeframe is the period in which Woopra will examine all your data of users that did at least 1 event during that time frame. You can choose today, last 7 days, last 30 days, last 90 days, last 365 days or any custom date range of your choice. The default date range is the last 30 days. We choose the last 365 days for this example.
Performed By
Think of this step as the segment or group of people you'll be analyzing. Either select an existing segment or create a new one on the fly, by clicking the “+” button in the “Performed By” section of your configuration. More info on how to create a Segment can be found here: Segments
Timeframe differencesIt is important to understand the Performed by timeframe configuration differs from the Timeframe configuration above. The Performed by timeframe will create a subset population of people from the Timeframe configuration section.
For example, let's take the following scenario -- You want to run a marketing campaign to target users that are currently active and also made a purchase on last year's Black Friday. First, you would set the Timeframe to the current month to select an initial group of ALL users that have performed at least one event in the current month. Next, under the Performed by timeframe, you select the event “purchased item” with the date for last year's Black Friday. Now, you will have a list of all active users from the past month that purchased an item last Black Friday. Typically the Performed by timeframe is less than or equal to the Timeframe configuration range.
Also here's a quick video explanation as well: https://share.getcloudapp.com/E0uzzAvP

Woopra supports nested segmentation filters as well as the ability to combine filters using AND / OR parameters as well. Additionally, you can add a split group to segment by multiple events or attributes.
Columns
Here you will select what columns you want to add to the report. Essentially this is what you want to group the results by. For example, you may want certain information on these users displayed such as emails, names or companies. You could select the properties that are the most relevant and important to your team.
People Metrics
People Metrics allows you to use aggregate functions on tracked events.
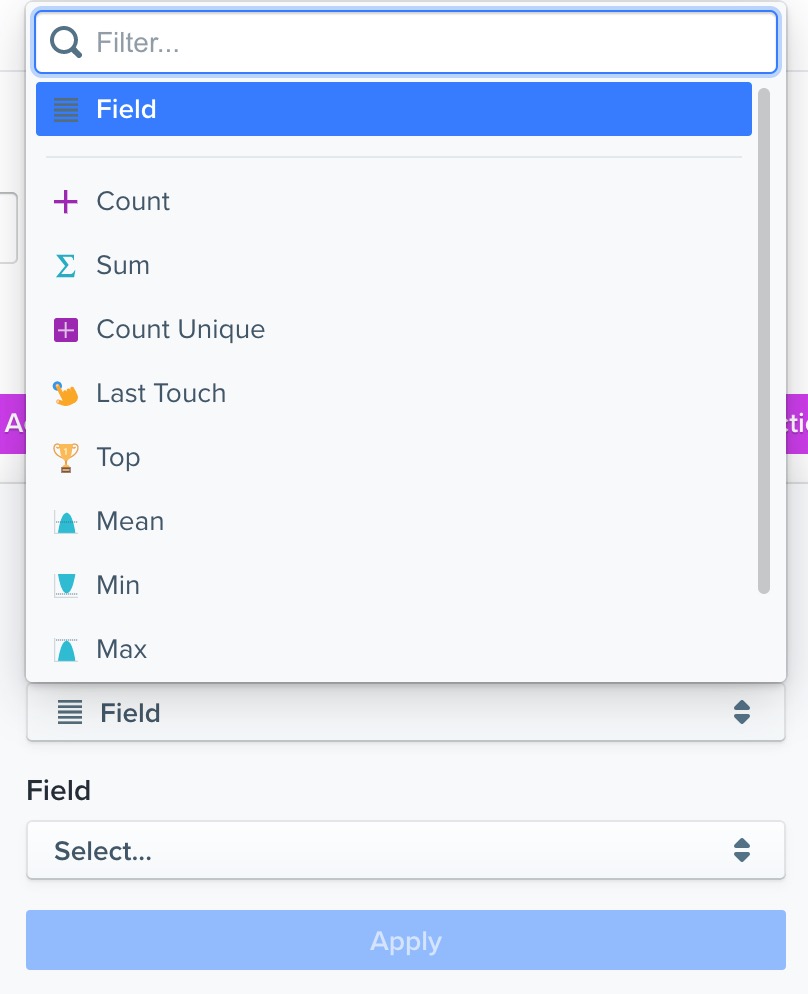
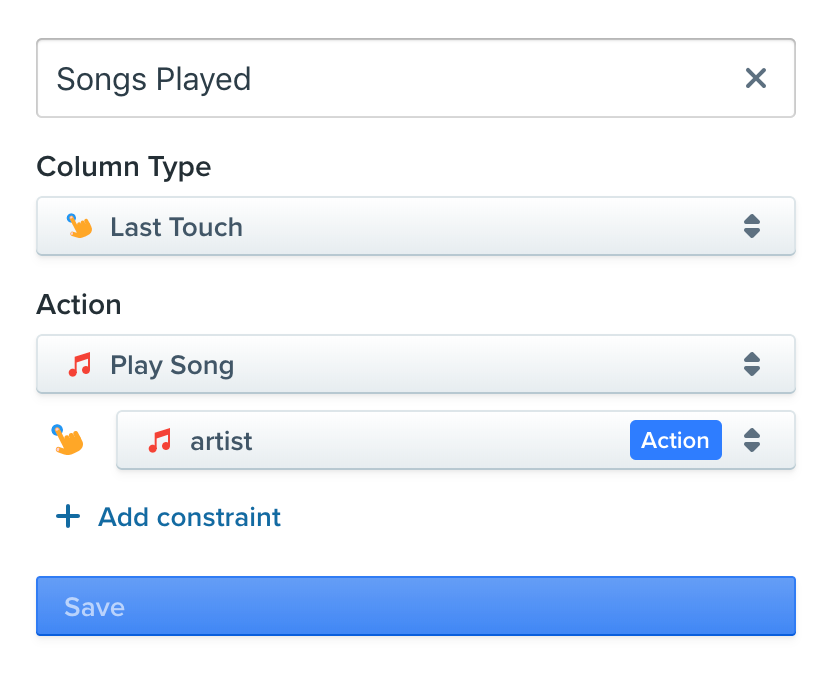
For example, if you select Last Touch and the event is 'Play Song,' then I can select either the timestamp when the user last played a song, or I can select a specific property like 'artist' to see the artist of the last song played.
To add a People Metric, you can click the plus on the Columns row.

Selecting “Sum” will count the total times a user has performed that event within the timeframe selected and include that sum next to the user. Selecting “Count” will count the total number of times a user has performed that action.
List of Operations
| Operation | Use | Example |
|---|---|---|
| Count | Counts the total number of times the selected event occurs. | Count the total number of songs a user played on your site. |
| Sum | Sums the total of an event property that is a number. | Sum the total revenue from a payment made events. |
| Count Unique | Count the unique number of times a selected event occurs. | Count the unique songs a user played on your site. |
| Last Touch | Displays the last event property of a specific event. | Show the last article a user viewed on your site. |
| Top | Displays the top occurrence of a specific event. | Show what feature the user was using the most. |
| Mean | Displays the average out of a set of numbers. | Show the average payment amount a user spends out of their purchase history. |
| Min | Displays the smallest value of a set of numbers. | Show the smallest order amount the user spent. |
| Max | Displays the highest value of a set of numbers. | Show the highest amount a user has loaded into their account. |
| First Touch | Displays the first event property of a specific event within a specified timeframe. | Show the first product a user purchased in the past 2 years. |
Formulas
You can perform row-based operations by using formulas. Please see our documentation on Formulas here.
Exporting and Sharing
Now that you've built your report, you'll want to share it with your team. You can do this by clicking on the 3 dots / ellipsis which will open an options menu for exporting, sharing, tagging, pinning, duplicating and reloading your report.
Remember, reports are not shared with your team by default, so you will need to share it for others to access it. Click share from the menu and select what team you want to share your report with.
Downloading
You can download the report in various formats: CSV, CSV (raw), PDF or HTML. Note that CSV (raw) will download some columns, such as average_session_length in total seconds. Exporting the regular CSV for these columns will download timestamps in a string format, e.g. 3 minutes, 21 seconds - 8 minutes, 20 seconds.
Updated 3 months ago
