
Attribution
An introduction to Woopra's Attribution features

One important aspect of understanding your traffic is knowing what drives conversions. While Journeys are great for understanding the paths that users take, you may need a different approach to understanding what attributing factors are driving conversions.
This is where our Attribution reports come in. With this report, you can quantify the effectiveness of various touchpoints or campaigns that lead to conversions.
Configuration
Attribution reports are comprised of 5 sections: Timeframe, Performed By, Initial Event, Touchpoints, and Conversions.
Timeframe
The timeframe is the period in which Woopra will examine the data of users who performed at least one event. You can choose today, last 7 days, last 30 days, last 90 days, last 365 days or any custom date range. The default date range is the last 30 days. In this example, we've selected the last 90 days.
.png")
The Timeframe will also include the initial events, touchpoints, and conversion events. You can specify the conversion timeframe within the Conversion Events' constraints. See the Conversion Events section for an example.
Performed By
Think of this step as the segment or group of people you'll be analyzing. Either select an existing segment or create a new one on the fly, by clicking the “+” button in the “Performed By” section of your configuration. More info on how to create a Segment can be found here: Segments

Timeframe differencesIt is important to understand the Performed by timeframe configuration differs from the Timeframe configuration above. The Performed by timeframe will create a subset population of people from the Timeframe configuration section.
For example, let's take the following scenario -- You want to run a marketing campaign to target users that are currently active and also made a purchase on last year's Black Friday. First, you would set the Timeframe to the current month to select an initial group of ALL users that have performed at least one event in the current month. Next, under the Performed by timeframe, you select the event “purchased item” with the date for last year's Black Friday. Now, you will have a list of all active users from the past month that purchased an item last Black Friday. Typically the Performed by timeframe is less than or equal to the Timeframe configuration range.
Also here's a quick video explanation as well: https://share.getcloudapp.com/E0uzzAvP

Woopra supports nested segmentation filters as well as the ability to combine filters using AND / OR operators. Additionally, you can add a split a group of events to segment by multiple events or attributes.
Initial Event
Here you will select the first event (or starting point) where you want the attribution analysis to begin within the selected timeframe.
For example, if you ran an email campaign that linked users to your pricing page, you could use this as your initial event to analyze. You would select a pageview event where the URL contains 'pricing'.
By default, the initial action is set to 'Any Action' with the constraint 'is first visit = true'. This means the default report will start the scan from a new user's first action when visiting the site within the time frame you selected for the report. Without the 'is first visit = true' constraint, the initial action will use the first action within the selected timeframe —meaning these could be return users who already have some actions prior to the Timeframe selection.
Touchpoints
These are the specific attribution events that you want to analyze. You can have multiple touchpoints that you want to analyze and you can give weight to the touches by changing the Attribution Model.
Expanding on the scenario above, say we ran multiple different campaigns that brought people to our pricing page. Assuming you used UTM tags in your links, we can analyze which campaigns are driving the most conversions.
In this example, we could select a page view event where campaign name = exists.
Dimension
The dimension is how you want the report broken down. For example, if you select ‘Campaign Name’ as the dimension, you will see an analysis of all the various campaign names in the report.

Conversion Events
This is the conversion event that you want to analyze, e.g. submitting a form, making a payment, or registering for an account. Users can select one or more conversion events. For example, users can choose two conversions: “add to carts” and “product_purchased”. Either of them would be calculated in Attribution calculations. If a profile has both conversions, the attribution analysis would include both if the Conversion Tracking is “All Conversions.”
In some scenarios, users would like to analyze attribution or see the distribution of touchpoints for a specific period of conversions. For example, marketers would like to analyze the conversions in May after they send out campaigns in late April. In this case, users can do:
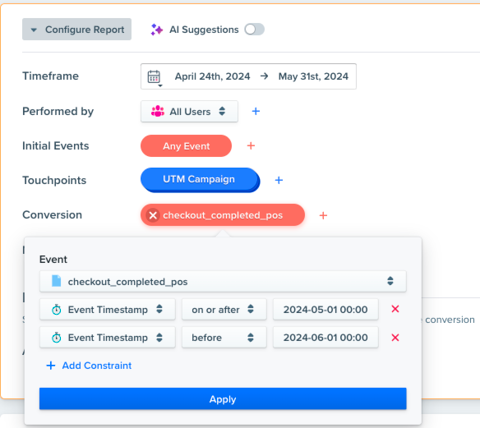
However, this is optional, as there is also an Attribution Window configuration that we'll cover below.
Conversion Tracking
This defines how many conversions would be included in Attribution analysis. When the Conversion Tracking is 'All conversions', it means that it would include all conversions from the initial event within the timeframe. However, if the Conversion Tracking is 'First conversion only', it will only consider the first conversion per profile within the timeframe and after the initial event.
Example:
Consider the customer’s activities in November 2023:
- The user clicks on an in-web campaign from an iPhone on 11/10 and makes a purchase of $500 from the website on the same day.
- The user clicks on an in-web campaign from an Android on 11/15 and makes a purchase of $500 from the website on the same day.
- The user opens and clicks a promotion link from an email on 11/20 and makes another purchase of $1,500 from a retail shop on 11/22.
For Conversion Tracking = “All conversions”, all purchases (11/10, 11/15, and 11/22) are considered. Metrics recalculated are:
- Count Actions: 3 (in-web: 2, email: 1)
- Sum of Purchase - Order Amount: $2,500 (in-web: 1,000, email: $1,500)
For Conversion Tracking = “First conversion only”, only the first purchase on 11/10 is considered. Metrics calculated are:
- Count Actions: 1 (in-web campaign)
- Sum of Purchase - Order Amount: $500
Attribution Window (when selecting 'All Conversions')
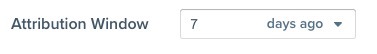
The Attribution Window specifies the duration for crediting touchpoints that lead to conversions within a certain timeframe. For instance, if the Attribution Window is set to 7 days, touchpoints like an in-web notification clicked 7 days before a conversion will be credited. However, interactions such as an email opened 10 days before the conversion will not be credited.
The maximum Attribution Window is currently 30 days.
The Attribution Window applies to all attribution models but is only relevant when selecting 'All Conversions'.
Only touchpoint events within the Attribution Window are counted. If there are no touchpoint events within the Attribution Window, the attribution will be counted as “No touchpoints”.
Metric
Depending on what you select for the conversion events, the report will reflect counts or sums. If you select 'count' of an event, this will display an attribution count based on the Attribution Model you select. If you select a 'sum', this will attribute a sum amount to the conversion.

Model
This is where you can select the Attribution model that you want to use. The model determines how you want to assign "credit" for the conversion. For example, say you have a user that came to your site from a Google Ad. Later, they came back from a Facebook ad and then converted. The model can be used to tell Woopra how you want to credit the conversion.
First, last and linear touch are the most common, but we also support more granular models such as time decay and multi-touch.
First Touch
The first touch receives 100% of the credit for the conversion.
In our example above, Google would be credited for the conversion.
Last Touch
The last touch receives 100% of the credit for the conversion.
In our example, Facebook would be credited for the conversion.
Decay
Touches closer to the conversion in time receive the most credit. When selecting Decay, you can enter the decay rate in seconds, minutes, hours, days, weeks or months.
For example, if you chose a decay rate of 2 hours, the touchpoints within these 2 hours will receive more credit than events that happen outside this time window.
Linear
Credit is distributed evenly across all touches.
In our example above, credit would be split 50-50 between Google and Facebook for the conversion.
Multi-Touch
Define the percentage of credit that the first and last touches will receive. The remaining credit is distributed evenly across the remaining touches.

Our final report. We can see in this report that Adwords was the highest performing campaign channel resulting in 92 people converting with 93 conversions (people can convert more than once). If the conversion event was a sum of payments, the attribution would be the total amount attributed to each touch.
Use Cases
In the following use cases, we are going to explain the logic of how conversion and attribution are calculated. Red time block illustrates the Attribution Window that users want to restrict the attribution calculation.
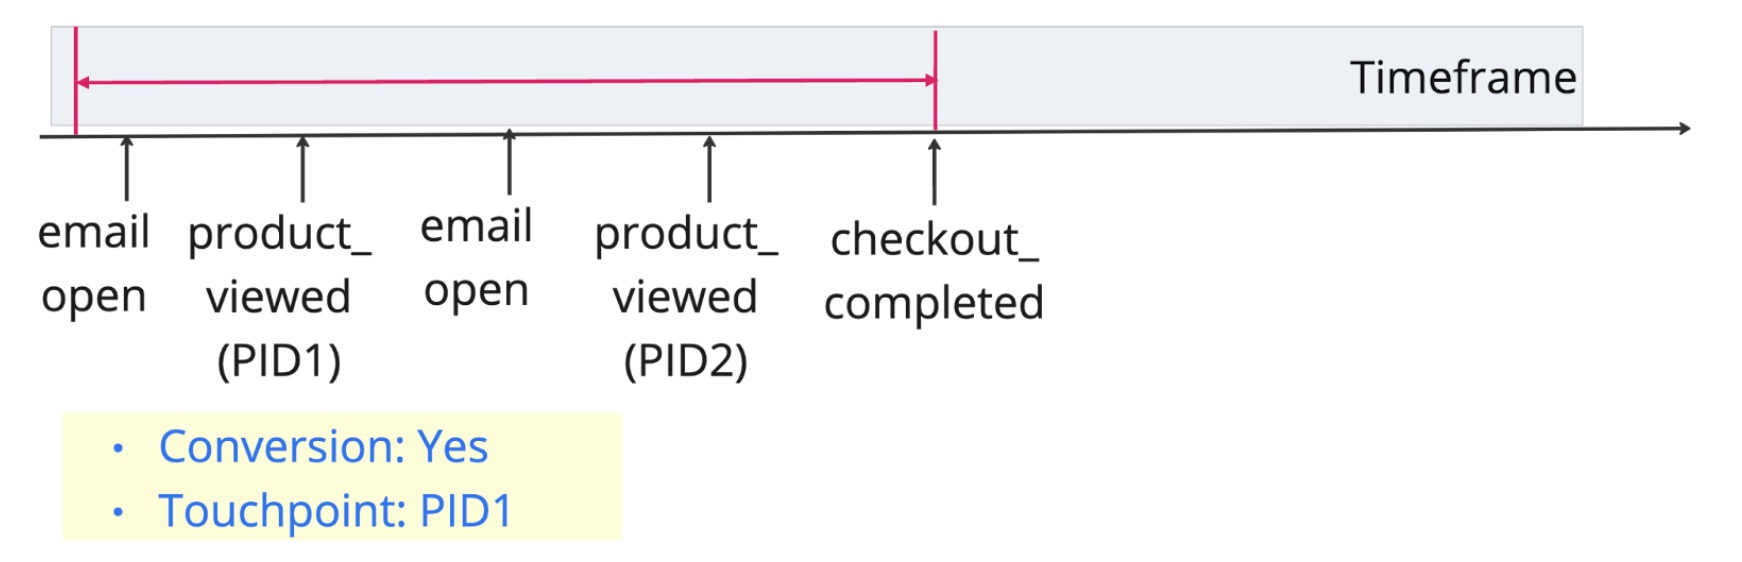
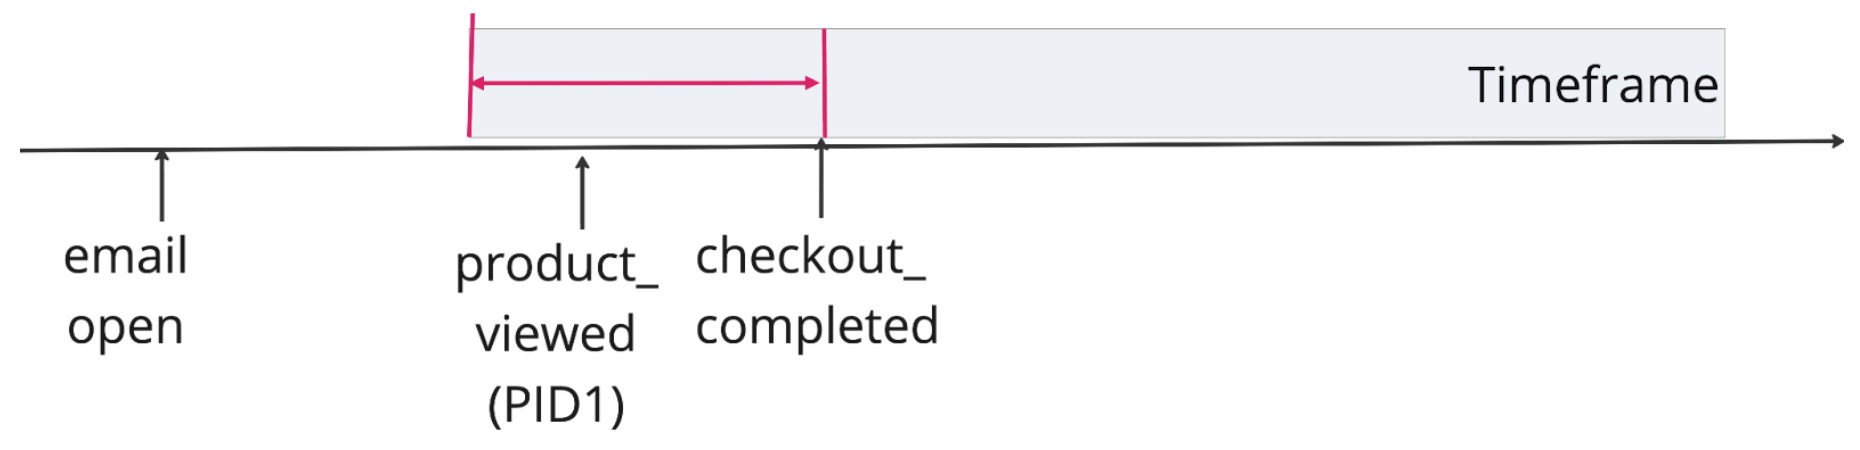
Use Case 1: Normal case
Email_open -> product_viewed -> email_open -> product_viewed -> checkout_completed
- Initial Event: email open
- Touchpoint: product_viewed (dimension: PID1)
- Conversion: checkout_completed
- Attribution model: first_touch
Scenario: A user opens an email, views a product, opens another email, views another product, and completes the checkout process. The first touch model credits the first product view as the contributing factor to the conversion. As a result, this conversion would be included, and touchpoint PID1 would be credited.
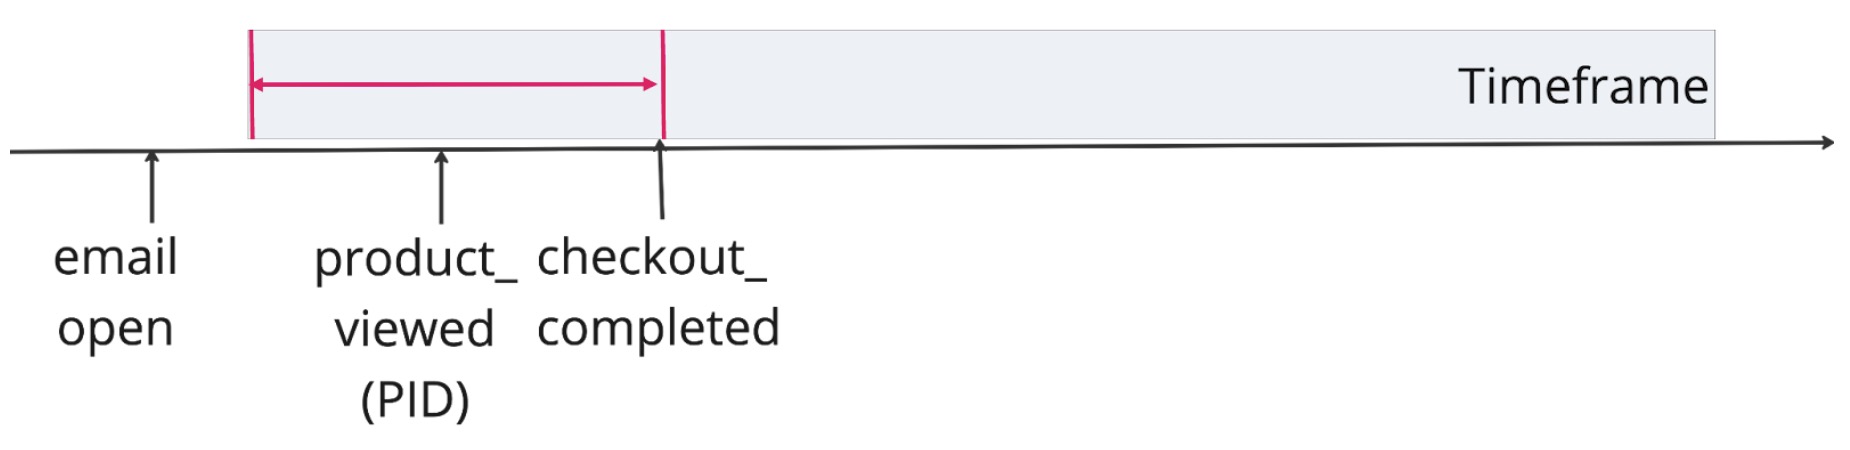
Use Case 2: Conversion is not counted
Email_open (out of timeframe) -> product_viewed -> checkout_completed
- Initial Event: email open
- Touchpoint: product_viewed (dimension: PID)
- Conversion: checkout_completed
- Attribution model: first_touch
Scenario: A user opens an email, views a product, and then completes the checkout process. However, the initial event (email open) is out of the timeframe, so the conversion is not credited.
Use Case 3: The initial condition (Initial Event: Any Action)
Touchpoint: product_viewed (dimension: PID)
- Conversion: checkout_completed
- Attribution model: last_touch
- Scenario: A user performs any action, views a product, and completes the checkout process. The last touch model credits the product view (PID1) as the contributing factor to the conversion.
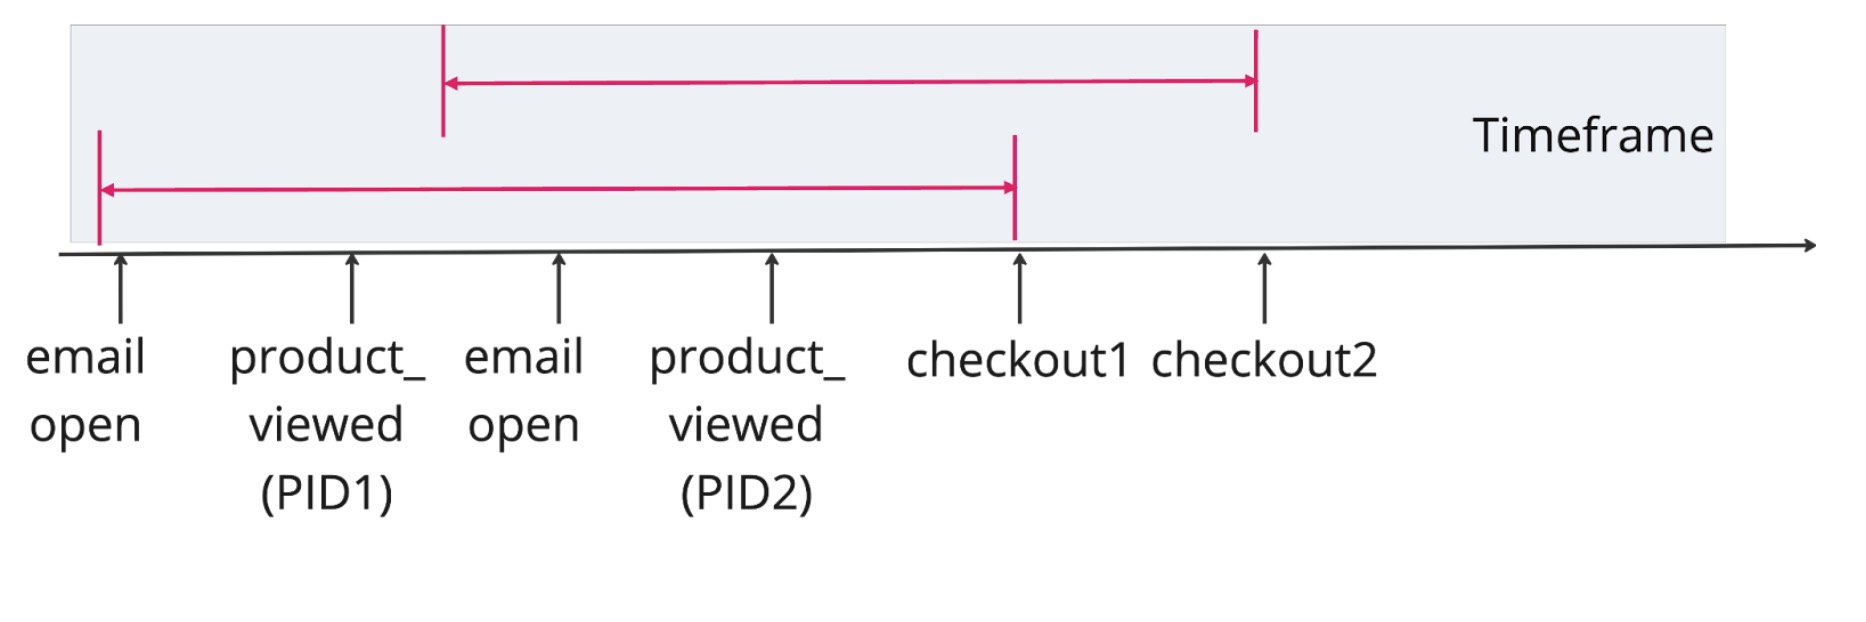
Use Case 4.3: Multiple touchpoints
- Email_open -> product_viewed -> email_open -> product_viewed -> checkout1 -> checkout2
- Initial Event: email open
- Touchpoint: product_viewed (dimension: PID)
- Conversion: checkout
- Attribution model: linear
Scenario: A user opens an email, views a product, opens email again, views another product, and completes two separate checkouts. The linear model credits both product views equally as contributing factors to the 1st checkout and credits PID2 again for the 2nd checkout within the attribution window.
Exporting and Sharing
Now that you've built your report, you'll want to share it with your team. You can do this by clicking on the 3 dots / ellipsis which will open an option menu for exporting, sharing, tagging, pinning, duplicating and reloading your report.

Downloading
You can download the report in various formats: CSV, CSV (raw), PDF or HTML. Note that CSV (raw) will download some columns, such as average_session_length in total seconds. Exporting the regular CSV for these columns will download timestamps in a string format, e.g. 3 minutes, 21 seconds - 8 minutes, 20 seconds.
Sharing
Remember, reports are not shared with your team by default. You'll need to share with teams or groups for others to have access. To do so, simply click share from the menu and select the teams you want to share your report with.
Snapshots
Snapshots generate a URL of the report you want to share. You can share this URL with anyone, whether they are apart of Woopra or not. This URL will link to a snapshot of the report you have created.
To take a snapshot, click the ellipsis and select snapshot. This will copy a URL for you to share. This is a public link, so anyone with the link will have access to that snapshot. This is an easy way to share reports with external teams or anyone whom you want to share the report with.
Editing the report will not change the snapshot, since the snapshot is a view of the report at the time when the snapshot was created.
Updated 8 months ago