
Cohort

Checkout our SaaS and eCommerce guides for more example Cohort reports.
Overview
Cohort Analysis allows you to measure the performance of cohorts, those who share common behaviors, over time. By breaking up your users into cohorts, you can understand how different activities across the organization impact specific cohorts throughout their lifecycle.
Teams across the organization can use Woopra’s Cohort Analytics to measure product engagement, marketing campaign efficiency, revenue trends, sales retention and more to increase customer health and stickiness over time.
Cohort Report Structure
A Cohort Analysis report is structured in 2 parts:
- The top chart aggregates all of the cohorts together, showing you the overall (average) retention rate of your users within a range of dates.
- The lower table displays the retention of individual cohorts independently to monitor any changes in retention rates over time within your date range.
How to create a Cohort Analysis Report
To start a new Cohort Analysis Report click “Analyze”, then “New Report” then “Cohort Report.”
Configurations
Cohort Reports are comprised of 5 sections: Timeframe, Performed By, Initial Event, Repeat Event, and Time Unit.
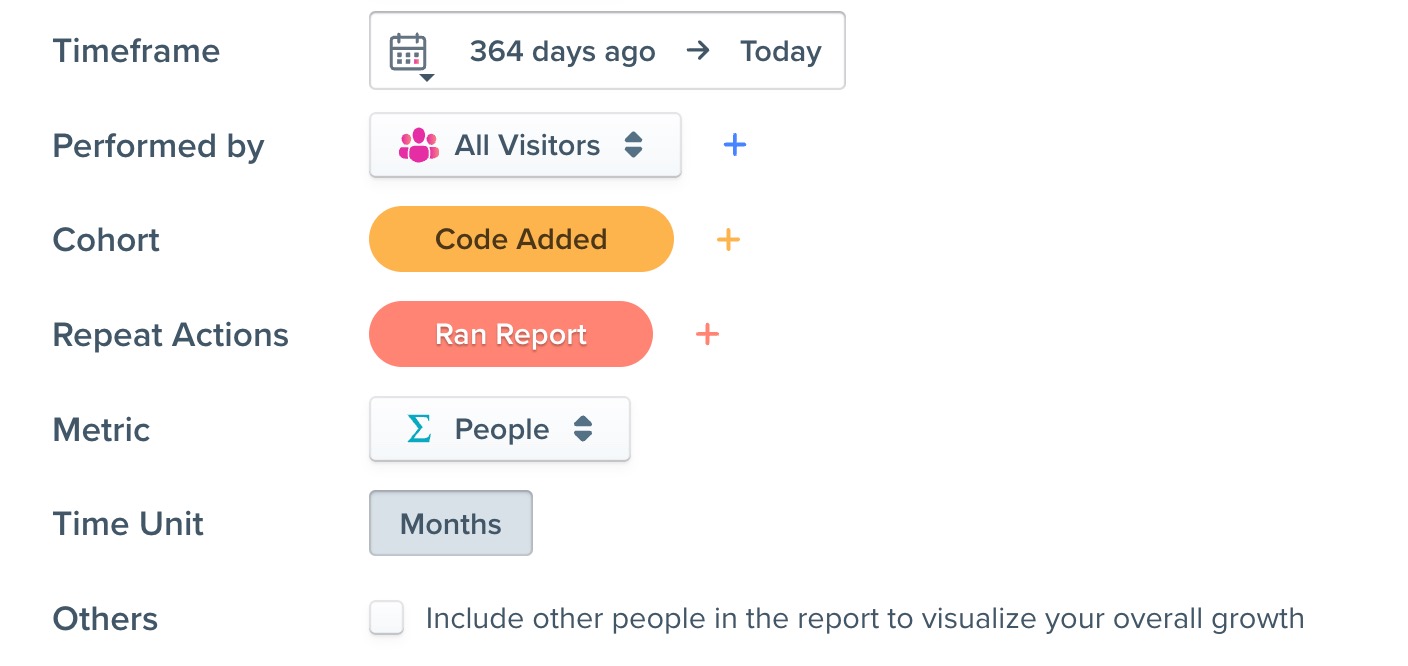
Timeframe
This is the first metric you should choose. Here, the timeframe is the period in which Woopra will examine all your data of users that did at least 1 event during that time frame. You can choose today, last 7 days, last 30 days, last 90 days, last 365 days or any custom date range of your choice. The default date range is the last 30 days. We choose the last 365 days for this example.

Performed By
Think of this step as the segment or group of people you'll be analyzing. Either select an existing segment or create a new one on the fly, by clicking the “+” button in the “Performed By” section of your configuration. More info on how to create a Segment can be found here: Segments
Timeframe DifferencesIt is important to understand the Performed by timeframe configuration differs from the Timeframe configuration above. The Performed by timeframe will create a subset population of people from the Timeframe configuration section.
For example, let's take the following scenario -- You want to run a marketing campaign to target users that are currently active and also made a purchase on last year's Black Friday. First, you would set the Timeframe to the current month to select an initial group of ALL users that have performed at least one event in the current month. Next, under the Performed by timeframe, you select the event “purchased item” with the date for last year's Black Friday. Now, you will have a list of all active users from the past month that purchased an item last Black Friday. Typically the Performed by timeframe is less than or equal to the Timeframe configuration range.
Also here's a quick video explanation as well: https://share.getcloudapp.com/E0uzzAvP
.gif")
Woopra supports nested segmentation filters as well as the ability to combine filters using AND / OR parameters. Additionally, you can add a split group to segment by multiple events or attributes.
Cohort
Here you will select the event you want to track for the cohort. This could also be considered the user's initial event.
Repeat Event
This is an event that demonstrates user engagement with your product (this might be a customer starting a meeting, making a payment, creating a report, sending an email, or simply returning to your website etc).
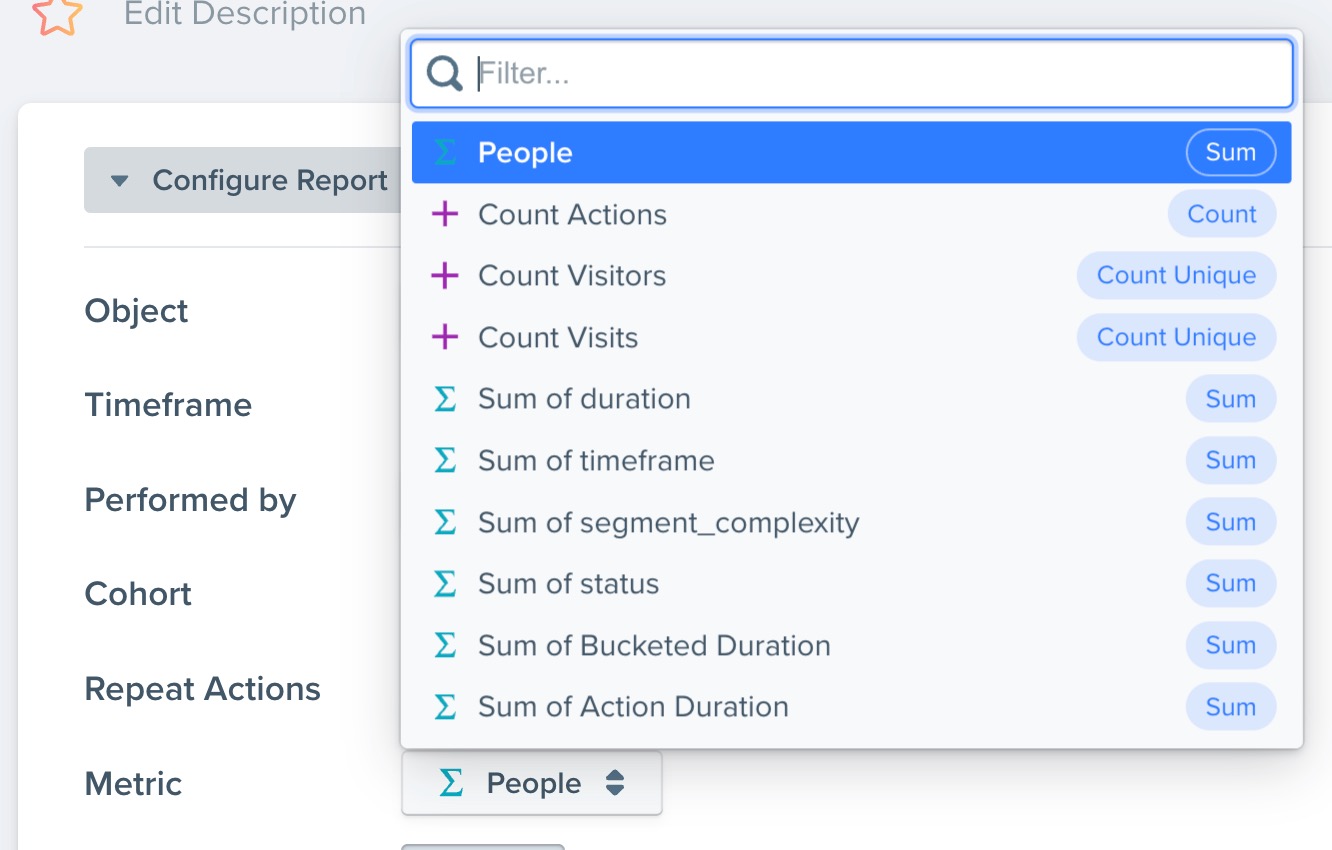
Metric
This is the aggregate count or sum of the event you are measuring. The available options can change depending on your _Repeat Event selection. For example, you can analyze the report based on the number of Users, Visits, or Events. However, if you select your repeat event as an event that contains an amount or duration properties, you may also see that you can select metrics like the sum of total, sum of duration, or other sums of properties that contain numeric types.
Time Unit
This is the amount of time you want to track after the initial event. You can choose N amount of days, weeks or months later.
Others
You can click the checkbox to disregard the initial timeframe to initial events and include all people who performed the repeat event for all time.
Exporting and Sharing
Now that you've built your report, you'll want to share it with your team. You can do this by clicking on the 3 dots/ellipsis, which will open an options menu for exporting, sharing, tagging, pinning, duplicating, and reloading your report.
Downloading
You can download the report in various formats: CSV, CSV (raw), PDF or HTML. Note that CSV (raw) will download some columns, such as average_session_length in total seconds. Exporting the regular CSV for these columns will download timestamps in a string format, e.g. 3 minutes, 21 seconds - 8 minutes, 20 seconds.
Sharing
Remember, reports are not shared with your team by default, so you will need to share it for others to access it. Click share from the menu and select what team you want to share your report with.
Snapshots
Snapshots generate a URL of the report you want to share. You can share this URL with anyone, whether they are apart of Woopra or not. This URL will link to a snapshot of the report you have created.
To take a snapshot, click the ellipsis and select snapshot. This will copy a URL for you to share. This is a public link, so anyone with the link will have access to that snapshot. This is an easy way to share reports with external teams or anyone whom you want to share the report with.
Editing the report will not change the snapshot, since the snapshot is a view of the report at the time when the snapshot was created.
Updated 8 months ago