Journeys (Beta)
An introduction to Woopra's newest Journeys features, now in Beta.

At Woopra, our mission has always been to solve what traditional funnels can't. Traditional funnels show a linear path to conversion and rarely allow for the exploration of what attributed to each step. That's where our new Journeys features come in. Journeys allow you to map the end-to-end customer experience to reflect multiple customer touchpoints and dive into what's driving each step.
Using Journeys, you'll be able to map the touchpoints that adapt to the real-time behavior of your users. This opens up a world of possibility for measuring where and how users convert.
With Journeys you can:
- Analyze your user's flow and replaces traditional navigation paths.
- Discover exactly attributes users moving through each step in the customer experience.
- Identify a user's first or last step before converting.
How to create a Journey Report
1: Lay out a plan
Creating a Journey takes a little forethought. You can break down this into three parts.
-
Select a Focus: This is the most important part of creating your Journey report. What story do you want your Journey report to tell? What questions are you trying to answer? Some examples include:
Analyzing the complete customer Journey (from first marketing touch through immersive product usage), a campaign conversion Journey, a product usage Journey, or even a user engagement or churn Journey. -
Start your Journey: Once you select your focus, select the starting point for your Journey. These can be things like first-time visitors, initiated set up, clicked on a new feature or clicked a paid ad. The initial step marks the beginning of your Journey.
-
List your Required steps: Journeys consist of Required steps and dynamic, footprint steps. Figure out your required steps first and then you can dive deeper into the attribution between these steps.
2: Building the report
Now that you have your steps mapped out, you can start building your Journey Report.
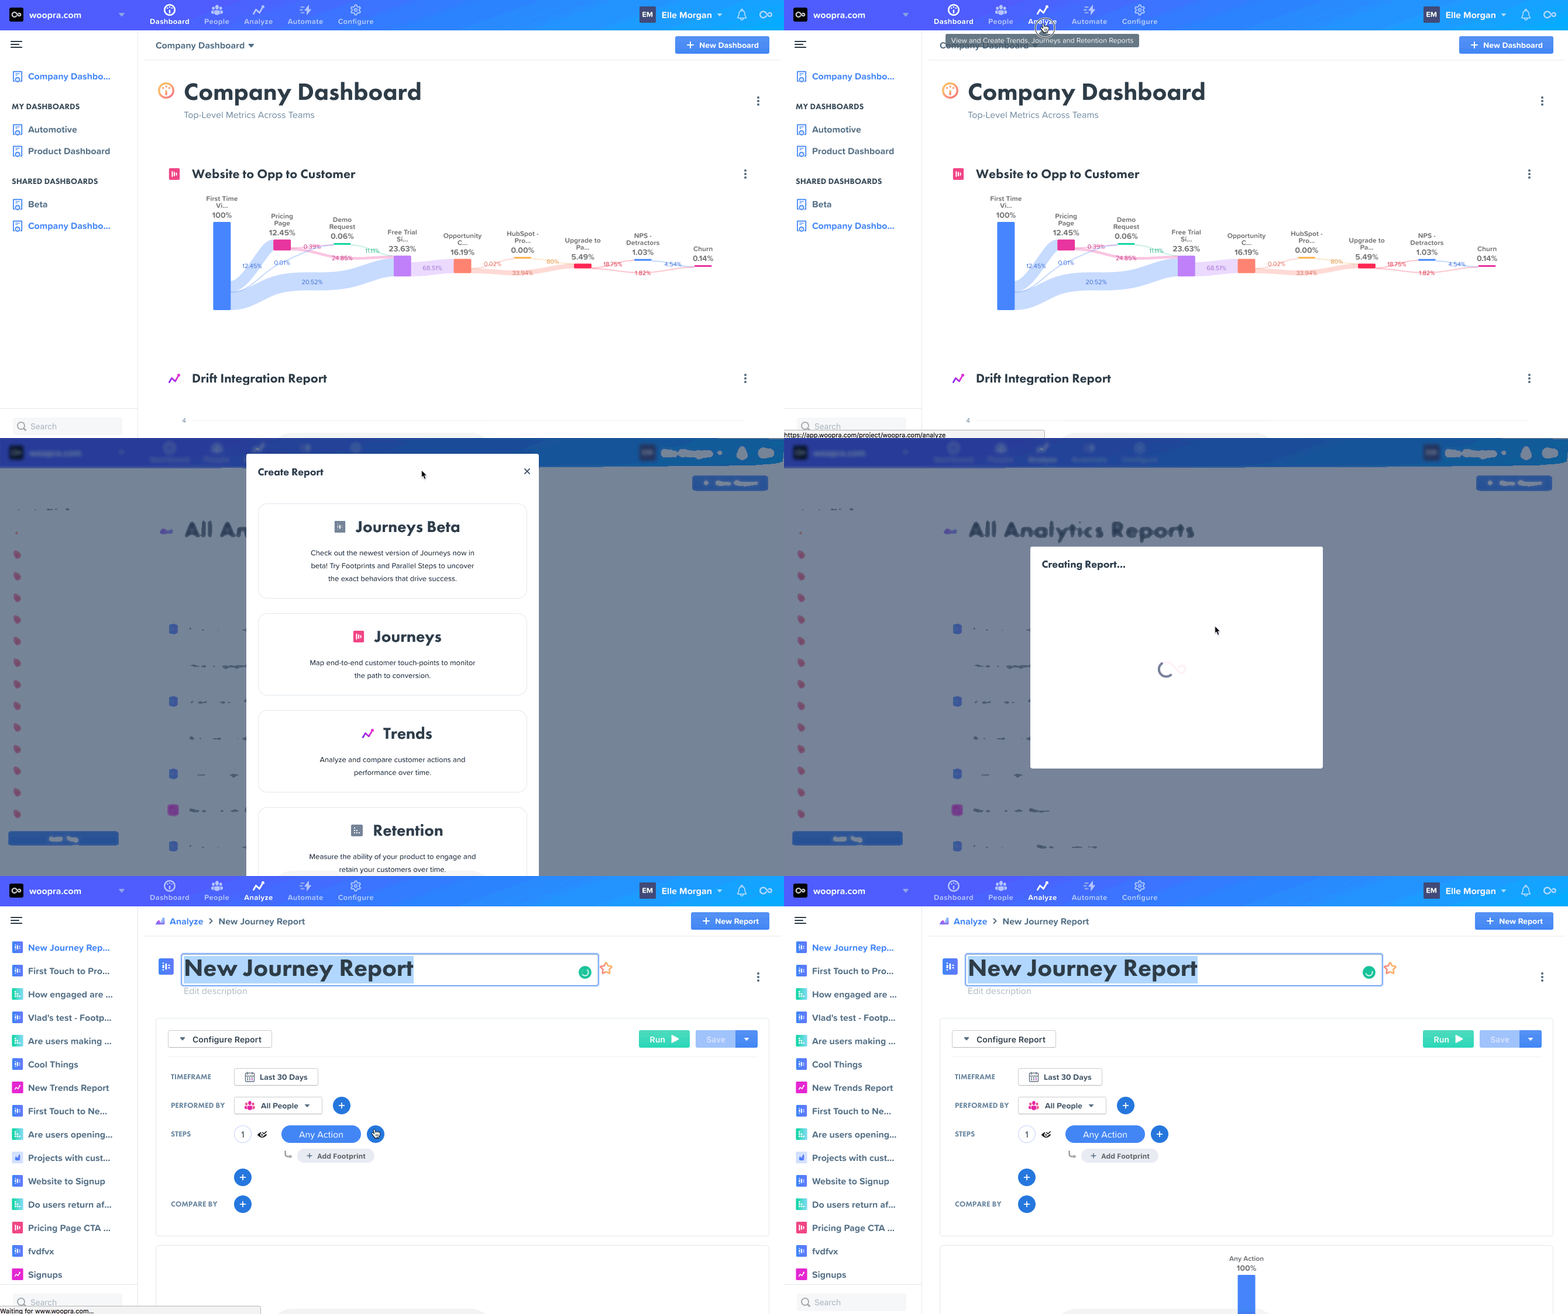
To get started, from the navigation bar click “Analyze,” then “New Report,” and then “Journeys Beta.”

Configuration
Journey reports are comprised of 4 sections: Timeframe, Performed By, Steps, and Compare by.
Timeframe
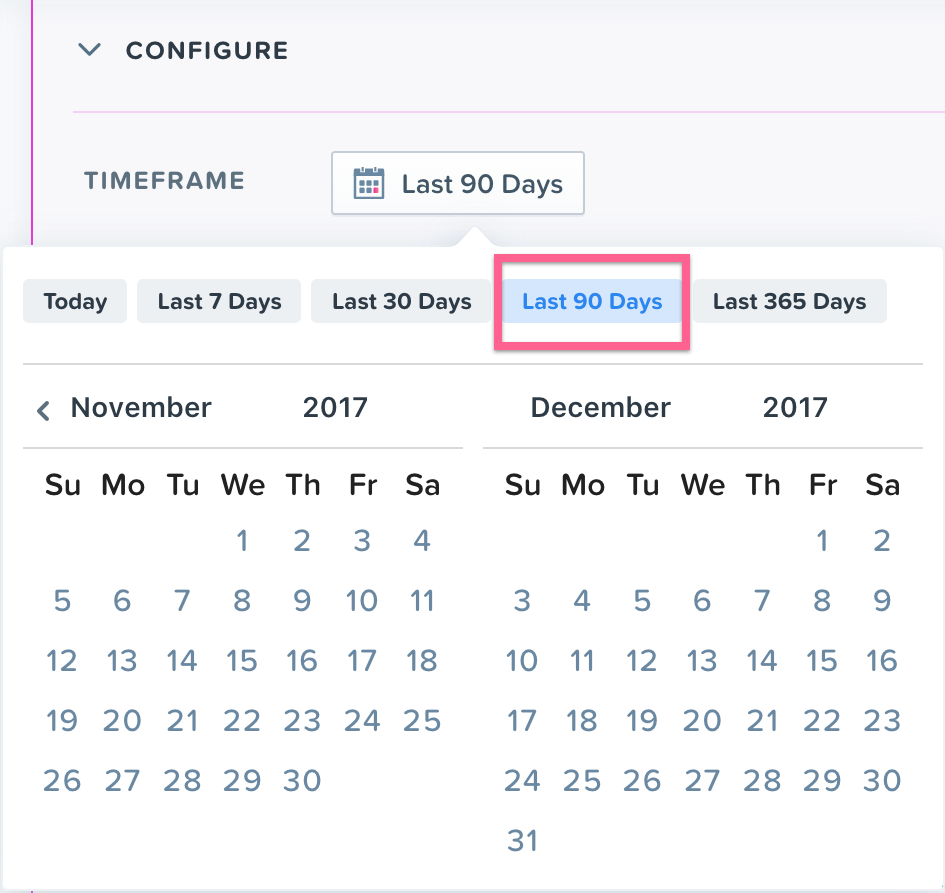
The timeframe is the period in which Woopra will examine the data of users who performed at least one action. You can choose today, last 7 days, last 30 days, last 90 days, last 365 days or any custom date range. The default date range is the last 30 days. In this example, we've selected the last 90 days.

Performed By
Think of this step as the segment or group of people you'll be analyzing. Either select an existing segment or create a new one on the fly, by clicking the “+” button in the “Performed By” section of your configuration. More info on how to create a Segment can be found here: Segments

It is important to understand the Performed by timeframe configuration differs from the Timeframe configuration above. The Performed by timeframe will create a subset population of people from the Timeframe configuration section. For example, let's take the following scenario -- You want to run a marketing campaign to target users that are currently active and also made a purchase on last years Black Friday. First, you would set the Timeframe to the current month to select an initial group of ALL users that have performed at least one action in the current month. Next, under the Performed by timeframe, you select the action “purchased item” with the date for last years Black Friday. Now, you will have a list of all active users from the past month that purchased an item last Black Friday. Typically the Performed by timeframe is less than or equal to the Timeframe configuration range.

Woopra supports nested segmentation filters as well as the ability to combine filters using AND / OR operators. Additionally, you can add a split a group of actions to segment by multiple actions or attributes.
Steps and Footprints
Once you've defined the timeframe and chosen the behavioral segment you want to analyze, select the steps to include in your journey. Each step is an action or set of actions that users may have done to reach the final step of the journey.
For example, if you wanted to understand the different touchpoints users go through after logging into your platform, you could add “Login” as Step 1, “Clicked Feature” as Step 2 and so on.
Required Steps - These are the steps that users must complete to move onto the next step. They can be goals such as visiting a signup page or performing a certain action. In order to continue through the journey, users must complete the required steps within the report timeframe.

You can add multiple steps side-by-side leveraging parallel steps. For example, if you want to see users who either became a new paying signup OR submitted a demo request before moving to the next step, you could add a parallel step for comparison.
There are 3 parts to the required steps action, aggregation and time window for subsequent steps.
- Action - Select the Action you'd like to analyze and, if you wish, the optional Property you want to filter on.
- Aggregation - By default this is aggregated by a count of 1.
- Time Window: Once you identify an action for a step, select your time window. The Time Window is essentially the amount of time a user can take to complete a given step from the first step.
Footprints - Between each Required Step, you can break down the user's path even further and see the optional paths they take.

There are 3 parts to these Footprints: The Footprint Model, the Action, and the Breakdown.

- First Footprint: This is the first occurrence or first action following the Required Goal. Say we had a user that did events in the order of X > ABC > Z.

Selecting the First Footprint, this user would be visualized as X > A > Z
- Last Footprint: This is the last occurrence or last event before the next Required goal. Let's look at the same the user who did X > ABC > Z

Selecting Last Footprint, that same user did X > C > Z
- Action - Select the Action you'd like to analyze and, if you wish, the optional Property you want to filter on.
- Breakdown By - Here you can select how you want to breakdown your action. You can either select no breakdown (marked as “none”) which will select only your one action, or you can dynamically select a group of actions such as a list of URLs.
Footprints are automatically sorted by top conversions as they relate to the next step.
Time Window:
Once you identify an action for a step, select your time window. The Time Window is essentially the amount of time a user can take to complete a given step from the first step.
Compare By:
Finally, with ‘Compare By’, you can identify the dimension that you want to use to analyze your Journey. These dimensions help you compare the performance of segments to see how they convert through the journey. Woopra offers a number of built-in dimensions out of the box.

Depending on your plan, you may choose from time, demographics, system properties, referrers, campaigns or visitor properties to compare the different dimensions that impact your journey. You can also choose from properties of the first step in the journey. By default, Woopra uses date (Cohort > Days) as the dimension to analyze. Free plans and Core plans are limited to 1 dimension only, which is “compare by days.”
Exporting and Sharing
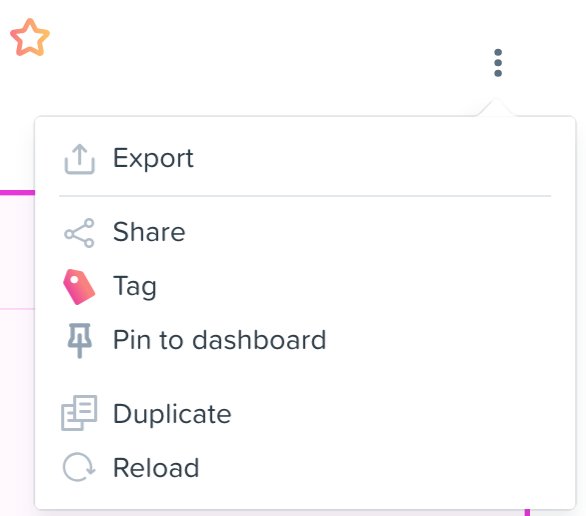
Now that you've built your report, you'll want to share it with your team. You can do this by clicking on the 3 dots / ellipsis which will open an option menu for exporting, sharing, tagging, pinning, duplicating and reloading your report.

Downloading
You can download the report in various formats: CSV, CSV (raw), PDF or HTML. Note that CSV (raw) will download some columns, such as average_session_length in total seconds. Exporting the regular CSV for these columns will download timestamps in a string format, e.g. 3 minutes, 21 seconds - 8 minutes, 20 seconds.
Sharing
Remember, reports are not shared with your team by default. You'll need to share with teams or groups for others to have access. To do so, simply click share from the menu and select the teams you want to share your report with.
Snapshots
Snapshots generate a URL of the report you want to share. You can share this URL with anyone, whether they are apart of Woopra or not. This URL will link to a snapshot of the report you have created.
To take a snapshot, click the ellipsis and select snapshot. This will copy a URL for you to share. This is a public link, so anyone with the link will have access to that snapshot. This is an easy way to share reports with external teams or anyone whom you want to share the report with.
Editing the report will not change the snapshot, since the snapshot is a view of the report at the time when the snapshot was created.
Updated 3 months ago
